

2 Principles and Characteristics of NIR Spectroscopy
17
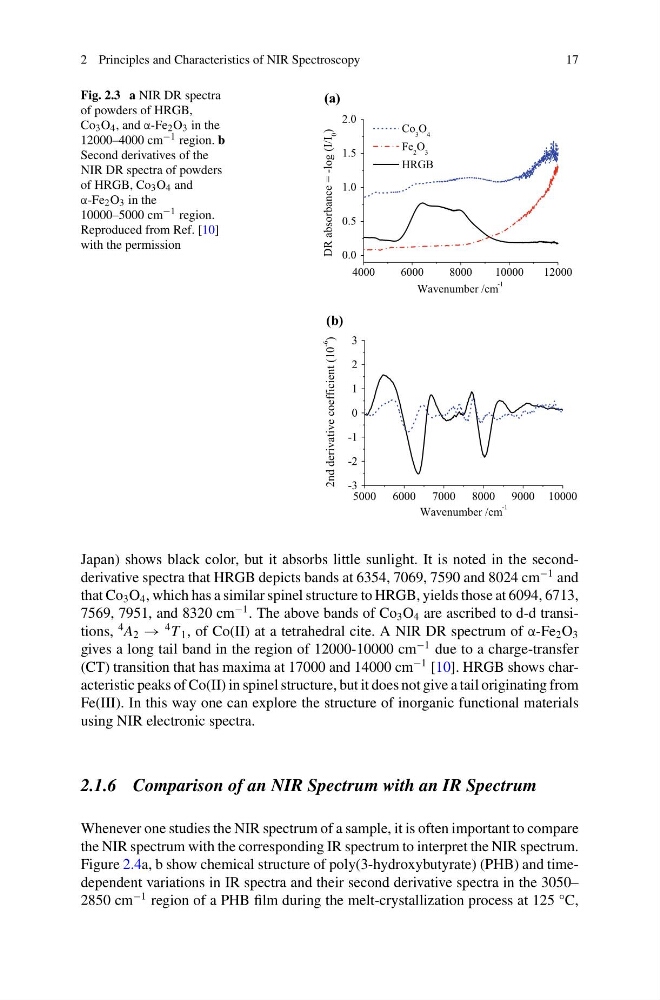
Fig. 2.3 a NIR DR spectra
of powders of HRGB,
Co 3 O 4 , and α-Fe 2 O 3 in the
12000–4000 cm −1 region. b
Second derivatives of the
NIR DR spectra of powders
of HRGB, Co 3 O 4 and
α-Fe 2 O 3 in the
10000–5000 cm −1 region.
Reproduced from Ref. [10]
with the permission
(a)
(b)
4000
6000
8000
10000
12000
0.0
0.5
1.0
1.5
2.0
Wavenumber /cm
-1
DR absorbance = -log (I/I
0
)
Co 3 O 4
Fe 2 O 3
HRGB
5000 6000 7000 8000 9000 10000
-3
-2
-1
0
1
2
3
2nd derivative coefficient (10
-6
)
Wavenumber /cm
-1
Japan) shows black color, but it absorbs little sunlight. It is noted in the secondderivative spectra that HRGB depicts bands at 6354, 7069, 7590 and 8024 cm
−1 and
that Co 3 O 4 , which has a similar spinel structure to HRGB, yields those at 6094, 6713,
7569, 7951, and 8320 cm
−1 . The above bands of Co 3 O 4 are ascribed to d-d transitions,
4 A 2 →
4 T 1 , of Co(II) at a tetrahedral cite. A NIR DR spectrum of α-Fe 2 O 3
gives a long tail band in the region of 12000-10000 cm
−1 due to a charge-transfer
(CT) transition that has maxima at 17000 and 14000 cm
−1 [10]. HRGB shows characteristic peaks of Co(II) in spinel structure, but it does not give a tail originating from
Fe(III). In this way one can explore the structure of inorganic functional materials
using NIR electronic spectra.
2.1.6 Comparison of an NIR Spectrum with an IR Spectrum
Whenever one studies the NIR spectrum of a sample, it is often important to compare
the NIR spectrum with the corresponding IR spectrum to interpret the NIR spectrum.
Figure 2.4a, b show chemical structure of poly(3-hydroxybutyrate) (PHB) and timedependent variations in IR spectra and their second derivative spectra in the 3050–
2850 cm
−1 region of a PHB film during the melt-crystallization process at 125 °C,
17
Fig. 2.3 a NIR DR spectra
of powders of HRGB,
Co 3 O 4 , and α-Fe 2 O 3 in the
12000–4000 cm −1 region. b
Second derivatives of the
NIR DR spectra of powders
of HRGB, Co 3 O 4 and
α-Fe 2 O 3 in the
10000–5000 cm −1 region.
Reproduced from Ref. [10]
with the permission
(a)
(b)
4000
6000
8000
10000
12000
0.0
0.5
1.0
1.5
2.0
Wavenumber /cm
-1
DR absorbance = -log (I/I
0
)
Co 3 O 4
Fe 2 O 3
HRGB
5000 6000 7000 8000 9000 10000
-3
-2
-1
0
1
2
3
2nd derivative coefficient (10
-6
)
Wavenumber /cm
-1
Japan) shows black color, but it absorbs little sunlight. It is noted in the secondderivative spectra that HRGB depicts bands at 6354, 7069, 7590 and 8024 cm
−1 and
that Co 3 O 4 , which has a similar spinel structure to HRGB, yields those at 6094, 6713,
7569, 7951, and 8320 cm
−1 . The above bands of Co 3 O 4 are ascribed to d-d transitions,
4 A 2 →
4 T 1 , of Co(II) at a tetrahedral cite. A NIR DR spectrum of α-Fe 2 O 3
gives a long tail band in the region of 12000-10000 cm
−1 due to a charge-transfer
(CT) transition that has maxima at 17000 and 14000 cm
−1 [10]. HRGB shows characteristic peaks of Co(II) in spinel structure, but it does not give a tail originating from
Fe(III). In this way one can explore the structure of inorganic functional materials
using NIR electronic spectra.
2.1.6 Comparison of an NIR Spectrum with an IR Spectrum
Whenever one studies the NIR spectrum of a sample, it is often important to compare
the NIR spectrum with the corresponding IR spectrum to interpret the NIR spectrum.
Figure 2.4a, b show chemical structure of poly(3-hydroxybutyrate) (PHB) and timedependent variations in IR spectra and their second derivative spectra in the 3050–
2850 cm
−1 region of a PHB film during the melt-crystallization process at 125 °C,