

7 NIR Data Exploration and Regression by Chemometrics—A Primer
169
1
2
3
4
5
6
7
8
9
1 0
Number of components
0.5
1
1.5
2
2.5
3
3.5
RMSECV
Raw
MSC
2nd dev
2nd dev SG (w=7)
2nd dev SG (w=15)
2nd dev SG (w=31)
2nd dev SG (w=7) + MSC
MSC + 2nd dev SG (w=7)
EMSC
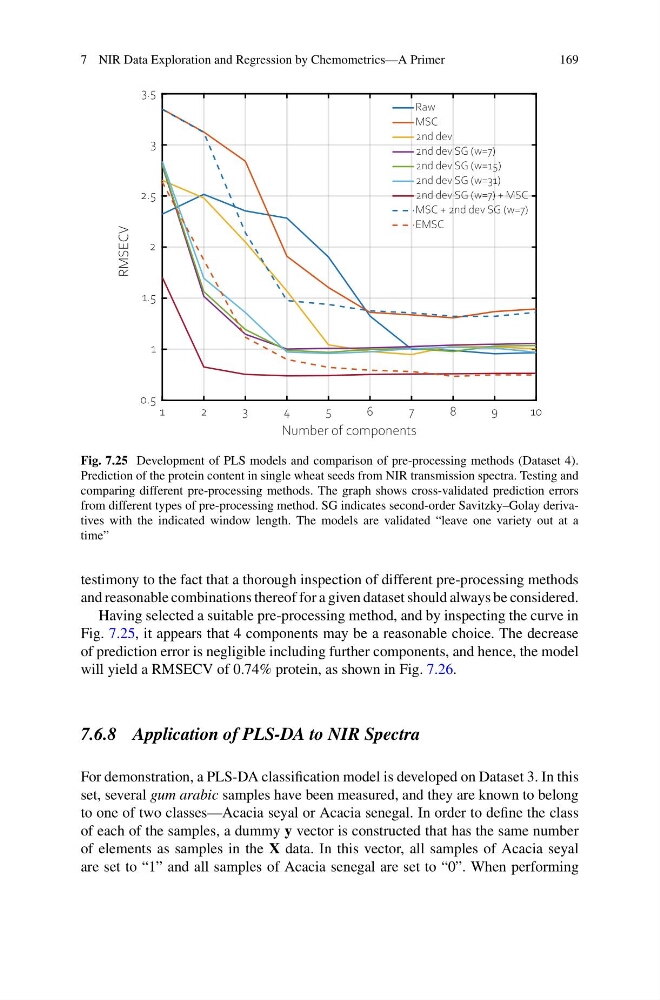
Fig. 7.25 Development of PLS models and comparison of pre-processing methods (Dataset 4).
Prediction of the protein content in single wheat seeds from NIR transmission spectra. Testing and
comparing different pre-processing methods. The graph shows cross-validated prediction errors
from different types of pre-processing method. SG indicates second-order Savitzky–Golay derivatives with the indicated window length. The models are validated “leave one variety out at a
time”
testimony to the fact that a thorough inspection of different pre-processing methods
and reasonable combinations thereof for a given dataset should always be considered.
Having selected a suitable pre-processing method, and by inspecting the curve in
Fig. 7.25, it appears that 4 components may be a reasonable choice. The decrease
of prediction error is negligible including further components, and hence, the model
will yield a RMSECV of 0.74% protein, as shown in Fig. 7.26.
7.6.8 Application of PLS-DA to NIR Spectra
For demonstration, a PLS-DA classification model is developed on Dataset 3. In this
set, several gum arabic samples have been measured, and they are known to belong
to one of two classes—Acacia seyal or Acacia senegal. In order to define the class
of each of the samples, a dummy y vector is constructed that has the same number
of elements as samples in the X data. In this vector, all samples of Acacia seyal
are set to “1” and all samples of Acacia senegal are set to “0”. When performing
169
1
2
3
4
5
6
7
8
9
1 0
Number of components
0.5
1
1.5
2
2.5
3
3.5
RMSECV
Raw
MSC
2nd dev
2nd dev SG (w=7)
2nd dev SG (w=15)
2nd dev SG (w=31)
2nd dev SG (w=7) + MSC
MSC + 2nd dev SG (w=7)
EMSC
Fig. 7.25 Development of PLS models and comparison of pre-processing methods (Dataset 4).
Prediction of the protein content in single wheat seeds from NIR transmission spectra. Testing and
comparing different pre-processing methods. The graph shows cross-validated prediction errors
from different types of pre-processing method. SG indicates second-order Savitzky–Golay derivatives with the indicated window length. The models are validated “leave one variety out at a
time”
testimony to the fact that a thorough inspection of different pre-processing methods
and reasonable combinations thereof for a given dataset should always be considered.
Having selected a suitable pre-processing method, and by inspecting the curve in
Fig. 7.25, it appears that 4 components may be a reasonable choice. The decrease
of prediction error is negligible including further components, and hence, the model
will yield a RMSECV of 0.74% protein, as shown in Fig. 7.26.
7.6.8 Application of PLS-DA to NIR Spectra
For demonstration, a PLS-DA classification model is developed on Dataset 3. In this
set, several gum arabic samples have been measured, and they are known to belong
to one of two classes—Acacia seyal or Acacia senegal. In order to define the class
of each of the samples, a dummy y vector is constructed that has the same number
of elements as samples in the X data. In this vector, all samples of Acacia seyal
are set to “1” and all samples of Acacia senegal are set to “0”. When performing