

132
K. M. Sørensen et al.
Glycose content [%]
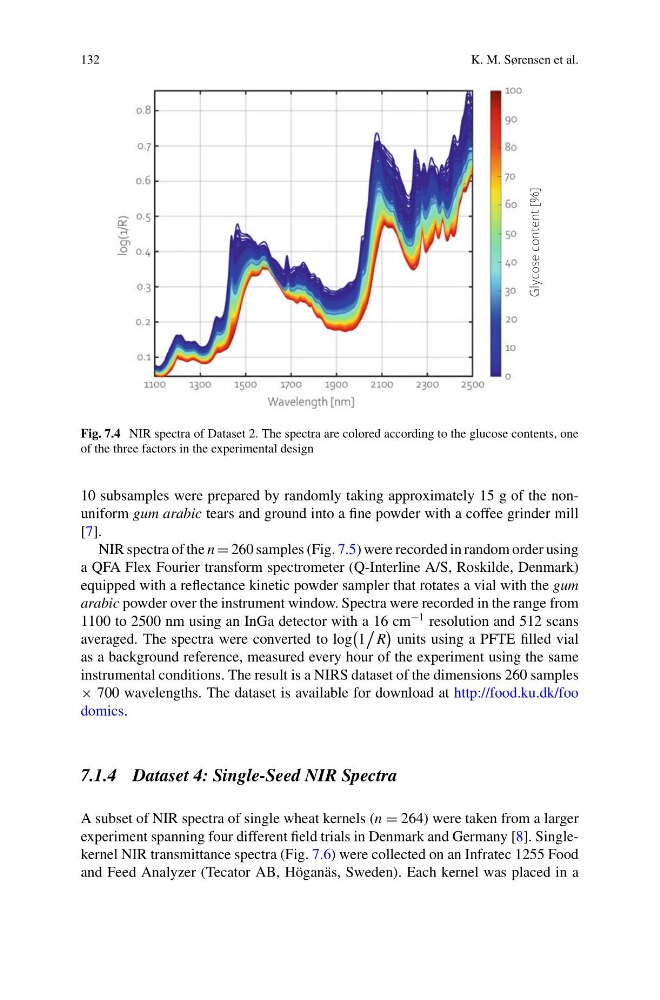
Fig. 7.4 NIR spectra of Dataset 2. The spectra are colored according to the glucose contents, one
of the three factors in the experimental design
10 subsamples were prepared by randomly taking approximately 15 g of the nonuniform gum arabic tears and ground into a fine powder with a coffee grinder mill
[7].
NIR spectra of the n = 260 samples (Fig. 7.5) were recorded in random order using
a QFA Flex Fourier transform spectrometer (Q-Interline A/S, Roskilde, Denmark)
equipped with a reflectance kinetic powder sampler that rotates a vial with the gum
arabic powder over the instrument window. Spectra were recorded in the range from
1100 to 2500 nm using an InGa detector with a 16 cm
−1 resolution and 512 scans
averaged. The spectra were converted to log
1
R
units using a PFTE filled vial
as a background reference, measured every hour of the experiment using the same
instrumental conditions. The result is a NIRS dataset of the dimensions 260 samples
× 700 wavelengths. The dataset is available for download at http://food.ku.dk/foo
domics.
7.1.4 Dataset 4: Single-Seed NIR Spectra
A subset of NIR spectra of single wheat kernels (n = 264) were taken from a larger
experiment spanning four different field trials in Denmark and Germany [8]. Singlekernel NIR transmittance spectra (Fig. 7.6) were collected on an Infratec 1255 Food
and Feed Analyzer (Tecator AB, Höganäs, Sweden). Each kernel was placed in a
K. M. Sørensen et al.
Glycose content [%]
Fig. 7.4 NIR spectra of Dataset 2. The spectra are colored according to the glucose contents, one
of the three factors in the experimental design
10 subsamples were prepared by randomly taking approximately 15 g of the nonuniform gum arabic tears and ground into a fine powder with a coffee grinder mill
[7].
NIR spectra of the n = 260 samples (Fig. 7.5) were recorded in random order using
a QFA Flex Fourier transform spectrometer (Q-Interline A/S, Roskilde, Denmark)
equipped with a reflectance kinetic powder sampler that rotates a vial with the gum
arabic powder over the instrument window. Spectra were recorded in the range from
1100 to 2500 nm using an InGa detector with a 16 cm
−1 resolution and 512 scans
averaged. The spectra were converted to log
1
R
units using a PFTE filled vial
as a background reference, measured every hour of the experiment using the same
instrumental conditions. The result is a NIRS dataset of the dimensions 260 samples
× 700 wavelengths. The dataset is available for download at http://food.ku.dk/foo
domics.
7.1.4 Dataset 4: Single-Seed NIR Spectra
A subset of NIR spectra of single wheat kernels (n = 264) were taken from a larger
experiment spanning four different field trials in Denmark and Germany [8]. Singlekernel NIR transmittance spectra (Fig. 7.6) were collected on an Infratec 1255 Food
and Feed Analyzer (Tecator AB, Höganäs, Sweden). Each kernel was placed in a