

7 NIR Data Exploration and Regression by Chemometrics—A Primer
131
1100
1300
1500
1700
1900
2100
2300
2500
Wavelength [nm]
0
0.1
0.2
0.3
0.4
0.5
0.6
0.7
0.8
0.9
log(1/R)
Degree of esterification [%]
2244 nm
0
10
20
30
40
50
60
70
80
90
100
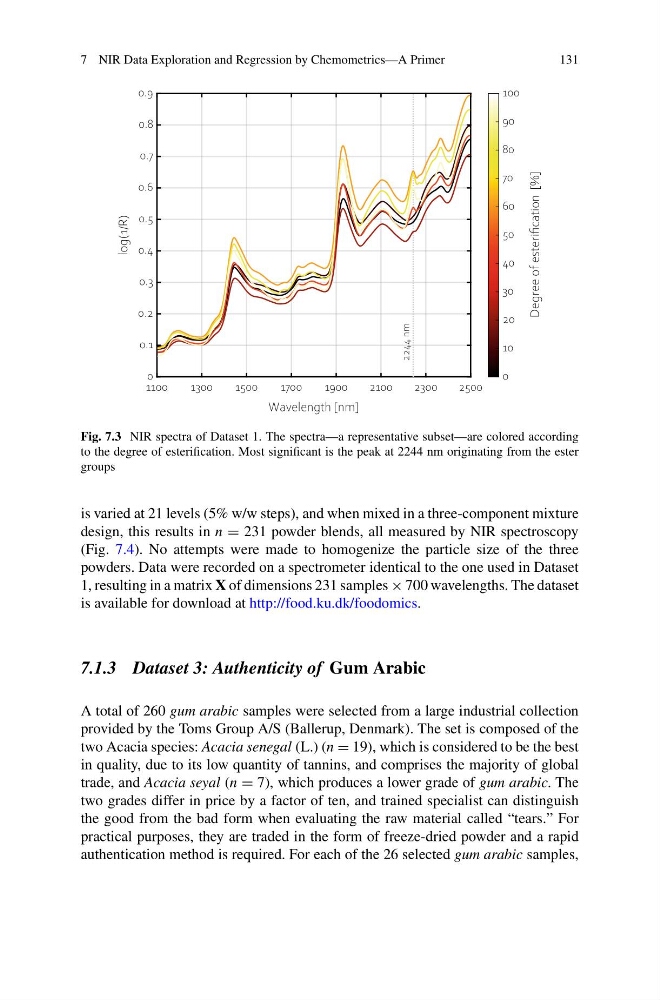
Fig. 7.3 NIR spectra of Dataset 1. The spectra—a representative subset—are colored according
to the degree of esterification. Most significant is the peak at 2244 nm originating from the ester
groups
is varied at 21 levels (5% w/w steps), and when mixed in a three-component mixture
design, this results in n = 231 powder blends, all measured by NIR spectroscopy
(Fig. 7.4). No attempts were made to homogenize the particle size of the three
powders. Data were recorded on a spectrometer identical to the one used in Dataset
1, resulting in a matrix X of dimensions 231 samples × 700 wavelengths. The dataset
is available for download at http://food.ku.dk/foodomics.
7.1.3 Dataset 3: Authenticity of Gum Arabic
A total of 260 gum arabic samples were selected from a large industrial collection
provided by the Toms Group A/S (Ballerup, Denmark). The set is composed of the
two Acacia species: Acacia senegal (L.) (n = 19), which is considered to be the best
in quality, due to its low quantity of tannins, and comprises the majority of global
trade, and Acacia seyal (n = 7), which produces a lower grade of gum arabic. The
two grades differ in price by a factor of ten, and trained specialist can distinguish
the good from the bad form when evaluating the raw material called “tears.” For
practical purposes, they are traded in the form of freeze-dried powder and a rapid
authentication method is required. For each of the 26 selected gum arabic samples,
131
1100
1300
1500
1700
1900
2100
2300
2500
Wavelength [nm]
0
0.1
0.2
0.3
0.4
0.5
0.6
0.7
0.8
0.9
log(1/R)
Degree of esterification [%]
2244 nm
0
10
20
30
40
50
60
70
80
90
100
Fig. 7.3 NIR spectra of Dataset 1. The spectra—a representative subset—are colored according
to the degree of esterification. Most significant is the peak at 2244 nm originating from the ester
groups
is varied at 21 levels (5% w/w steps), and when mixed in a three-component mixture
design, this results in n = 231 powder blends, all measured by NIR spectroscopy
(Fig. 7.4). No attempts were made to homogenize the particle size of the three
powders. Data were recorded on a spectrometer identical to the one used in Dataset
1, resulting in a matrix X of dimensions 231 samples × 700 wavelengths. The dataset
is available for download at http://food.ku.dk/foodomics.
7.1.3 Dataset 3: Authenticity of Gum Arabic
A total of 260 gum arabic samples were selected from a large industrial collection
provided by the Toms Group A/S (Ballerup, Denmark). The set is composed of the
two Acacia species: Acacia senegal (L.) (n = 19), which is considered to be the best
in quality, due to its low quantity of tannins, and comprises the majority of global
trade, and Acacia seyal (n = 7), which produces a lower grade of gum arabic. The
two grades differ in price by a factor of ten, and trained specialist can distinguish
the good from the bad form when evaluating the raw material called “tears.” For
practical purposes, they are traded in the form of freeze-dried powder and a rapid
authentication method is required. For each of the 26 selected gum arabic samples,