

7 NIR Data Exploration and Regression by Chemometrics—A Primer
133
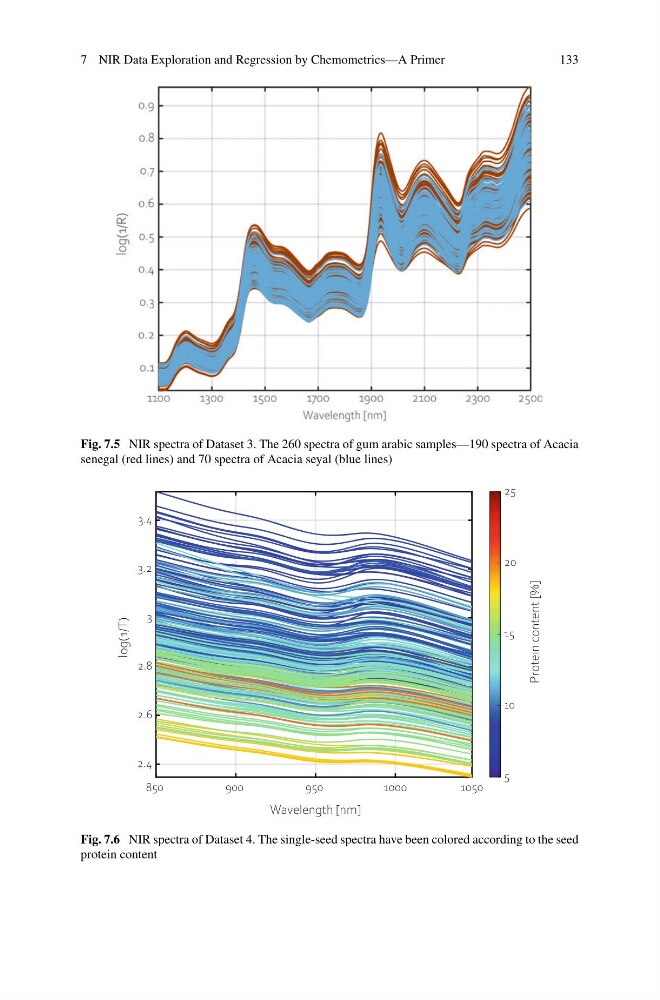
Fig. 7.5 NIR spectra of Dataset 3. The 260 spectra of gum arabic samples—190 spectra of Acacia
senegal (red lines) and 70 spectra of Acacia seyal (blue lines)
850
900
950
1000
1050
Wavelength [nm]
2.4
2.6
2.8
3
3.2
3.4
log(1/T)
Protein content [%]
5
10
15
20
25
Fig. 7.6 NIR spectra of Dataset 4. The single-seed spectra have been colored according to the seed
protein content
133
Fig. 7.5 NIR spectra of Dataset 3. The 260 spectra of gum arabic samples—190 spectra of Acacia
senegal (red lines) and 70 spectra of Acacia seyal (blue lines)
850
900
950
1000
1050
Wavelength [nm]
2.4
2.6
2.8
3
3.2
3.4
log(1/T)
Protein content [%]
5
10
15
20
25
Fig. 7.6 NIR spectra of Dataset 4. The single-seed spectra have been colored according to the seed
protein content