

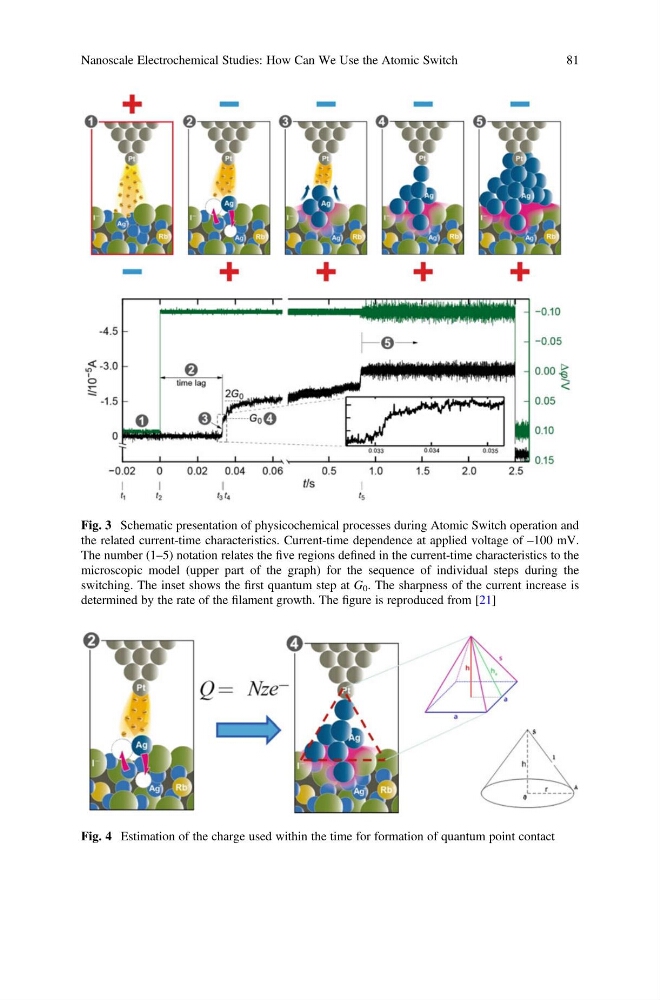
Fig. 3 Schematic presentation of physicochemical processes during Atomic Switch operation and
the related current-time characteristics. Current-time dependence at applied voltage of –100 mV.
The number (1–5) notation relates the five regions defined in the current-time characteristics to the
microscopic model (upper part of the graph) for the sequence of individual steps during the
switching. The inset shows the first quantum step at G 0 . The sharpness of the current increase is
determined by the rate of the filament growth. The figure is reproduced from [21]
Fig. 4 Estimation of the charge used within the time for formation of quantum point contact
Nanoscale Electrochemical Studies: How Can We Use the Atomic Switch
81
the related current-time characteristics. Current-time dependence at applied voltage of –100 mV.
The number (1–5) notation relates the five regions defined in the current-time characteristics to the
microscopic model (upper part of the graph) for the sequence of individual steps during the
switching. The inset shows the first quantum step at G 0 . The sharpness of the current increase is
determined by the rate of the filament growth. The figure is reproduced from [21]
Fig. 4 Estimation of the charge used within the time for formation of quantum point contact
Nanoscale Electrochemical Studies: How Can We Use the Atomic Switch
81