

Ag 2 S system, the increasing values of τ for the successive curves suggest that the
decay of conductance contains a history of previous inputs arising from the
non-stoichiometry and rearrangement of Cu
+ ions at the subsurface of Cu 2 S.
Despite the similarities between the Ag 2 S and Cu 2 S systems, certain differences
in their operations are noteworthy. For instance, the operation voltage of Cu 2 S
synapses was found to be higher compared to the Ag 2 S synapses. A possible reason
might be the higher activation energy for the migration of Cu
+ ions than that of Ag
+
ions in sulphides. Another significant difference was found in their operations under
varied ambient conditions. While the Ag 2 S synapse exhibited almost similar behavior in both ambient and vacuum, the operation of the Cu 2 S synapse was highly
influenced by the presence of air (relative humidity of ~50%). Compared to its
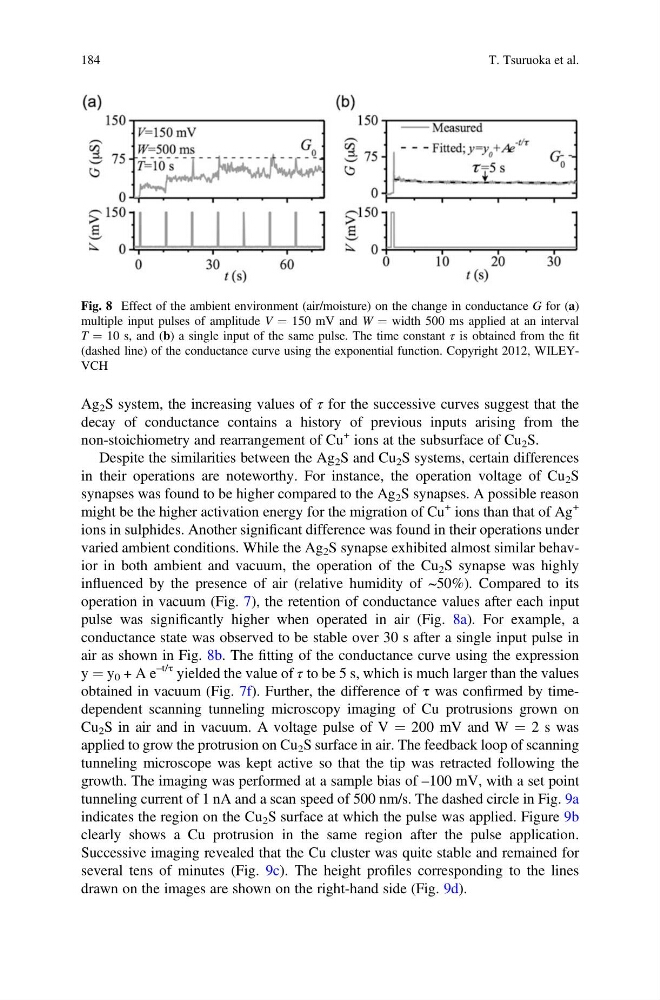
operation in vacuum (Fig. 7), the retention of conductance values after each input
pulse was significantly higher when operated in air (Fig. 8a). For example, a
conductance state was observed to be stable over 30 s after a single input pulse in
air as shown in Fig. 8b. The fitting of the conductance curve using the expression
y ¼ y 0 + A e
–t/τ yielded the value of τ to be 5 s, which is much larger than the values
obtained in vacuum (Fig. 7f). Further, the difference of τ was confirmed by timedependent scanning tunneling microscopy imaging of Cu protrusions grown on
Cu 2 S in air and in vacuum. A voltage pulse of V ¼ 200 mV and W ¼ 2 s was
applied to grow the protrusion on Cu 2 S surface in air. The feedback loop of scanning
tunneling microscope was kept active so that the tip was retracted following the
growth. The imaging was performed at a sample bias of –100 mV, with a set point
tunneling current of 1 nA and a scan speed of 500 nm/s. The dashed circle in Fig. 9a
indicates the region on the Cu 2 S surface at which the pulse was applied. Figure 9b
clearly shows a Cu protrusion in the same region after the pulse application.
Successive imaging revealed that the Cu cluster was quite stable and remained for
several tens of minutes (Fig. 9c). The height profiles corresponding to the lines
drawn on the images are shown on the right-hand side (Fig. 9d).
Fig. 8 Effect of the ambient environment (air/moisture) on the change in conductance G for (a)
multiple input pulses of amplitude V ¼ 150 mV and W ¼ width 500 ms applied at an interval
T ¼ 10 s, and (b) a single input of the same pulse. The time constant τ is obtained from the fit
(dashed line) of the conductance curve using the exponential function. Copyright 2012, WILEYVCH
184
T. Tsuruoka et al.
decay of conductance contains a history of previous inputs arising from the
non-stoichiometry and rearrangement of Cu
+ ions at the subsurface of Cu 2 S.
Despite the similarities between the Ag 2 S and Cu 2 S systems, certain differences
in their operations are noteworthy. For instance, the operation voltage of Cu 2 S
synapses was found to be higher compared to the Ag 2 S synapses. A possible reason
might be the higher activation energy for the migration of Cu
+ ions than that of Ag
+
ions in sulphides. Another significant difference was found in their operations under
varied ambient conditions. While the Ag 2 S synapse exhibited almost similar behavior in both ambient and vacuum, the operation of the Cu 2 S synapse was highly
influenced by the presence of air (relative humidity of ~50%). Compared to its
operation in vacuum (Fig. 7), the retention of conductance values after each input
pulse was significantly higher when operated in air (Fig. 8a). For example, a
conductance state was observed to be stable over 30 s after a single input pulse in
air as shown in Fig. 8b. The fitting of the conductance curve using the expression
y ¼ y 0 + A e
–t/τ yielded the value of τ to be 5 s, which is much larger than the values
obtained in vacuum (Fig. 7f). Further, the difference of τ was confirmed by timedependent scanning tunneling microscopy imaging of Cu protrusions grown on
Cu 2 S in air and in vacuum. A voltage pulse of V ¼ 200 mV and W ¼ 2 s was
applied to grow the protrusion on Cu 2 S surface in air. The feedback loop of scanning
tunneling microscope was kept active so that the tip was retracted following the
growth. The imaging was performed at a sample bias of –100 mV, with a set point
tunneling current of 1 nA and a scan speed of 500 nm/s. The dashed circle in Fig. 9a
indicates the region on the Cu 2 S surface at which the pulse was applied. Figure 9b
clearly shows a Cu protrusion in the same region after the pulse application.
Successive imaging revealed that the Cu cluster was quite stable and remained for
several tens of minutes (Fig. 9c). The height profiles corresponding to the lines
drawn on the images are shown on the right-hand side (Fig. 9d).
Fig. 8 Effect of the ambient environment (air/moisture) on the change in conductance G for (a)
multiple input pulses of amplitude V ¼ 150 mV and W ¼ width 500 ms applied at an interval
T ¼ 10 s, and (b) a single input of the same pulse. The time constant τ is obtained from the fit
(dashed line) of the conductance curve using the exponential function. Copyright 2012, WILEYVCH
184
T. Tsuruoka et al.