

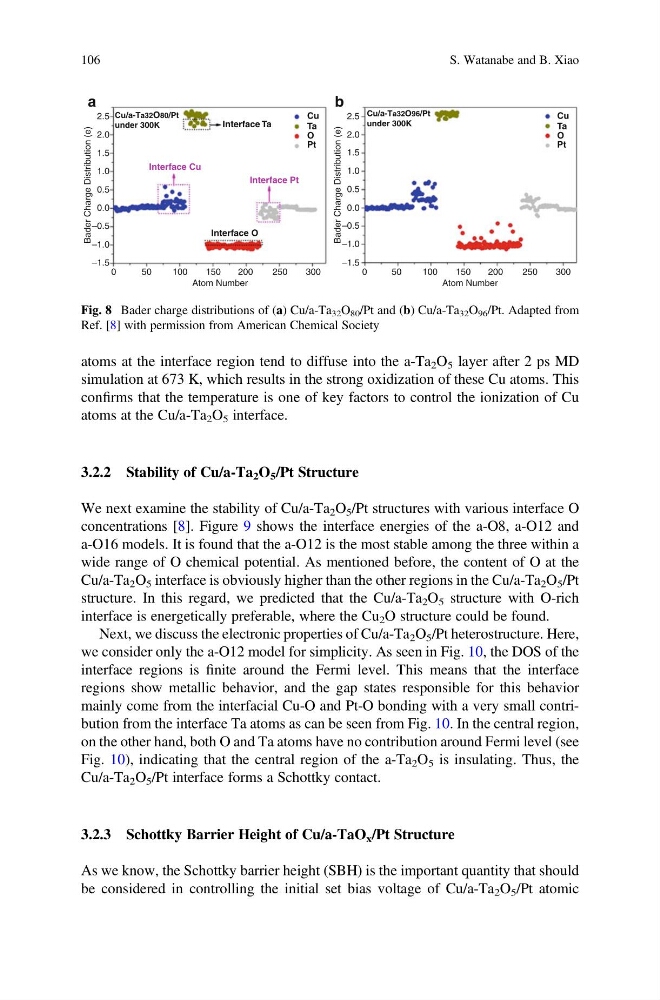
atoms at the interface region tend to diffuse into the a-Ta 2 O 5 layer after 2 ps MD
simulation at 673 K, which results in the strong oxidization of these Cu atoms. This
confirms that the temperature is one of key factors to control the ionization of Cu
atoms at the Cu/a-Ta 2 O 5 interface.
3.2.2 Stability of Cu/a-Ta 2 O 5 /Pt Structure
We next examine the stability of Cu/a-Ta 2 O 5 /Pt structures with various interface O
concentrations [8]. Figure 9 shows the interface energies of the a-O8, a-O12 and
a-O16 models. It is found that the a-O12 is the most stable among the three within a
wide range of O chemical potential. As mentioned before, the content of O at the
Cu/a-Ta 2 O 5 interface is obviously higher than the other regions in the Cu/a-Ta 2 O 5 /Pt
structure. In this regard, we predicted that the Cu/a-Ta 2 O 5 structure with O-rich
interface is energetically preferable, where the Cu 2 O structure could be found.
Next, we discuss the electronic properties of Cu/a-Ta 2 O 5 /Pt heterostructure. Here,
we consider only the a-O12 model for simplicity. As seen in Fig. 10, the DOS of the
interface regions is finite around the Fermi level. This means that the interface
regions show metallic behavior, and the gap states responsible for this behavior
mainly come from the interfacial Cu-O and Pt-O bonding with a very small contribution from the interface Ta atoms as can be seen from Fig. 10. In the central region,
on the other hand, both O and Ta atoms have no contribution around Fermi level (see
Fig. 10), indicating that the central region of the a-Ta 2 O 5 is insulating. Thus, the
Cu/a-Ta 2 O 5 /Pt interface forms a Schottky contact.
3.2.3 Schottky Barrier Height of Cu/a-TaO x /Pt Structure
As we know, the Schottky barrier height (SBH) is the important quantity that should
be considered in controlling the initial set bias voltage of Cu/a-Ta 2 O 5 /Pt atomic
2.5
2.0
1.5
1.0
0.5
0.0
–0.5
–1.0
–1.5
0
Cu/a-Ta32O80/Pt
under 300K
Cu/a-Ta32O96/Pt
under 300K
Cu
Ta
O
Pt
Cu
Ta
O
Pt
Interface Ta
Interface Pt
Interface Cu
Interface O
50
100
150
200
250
300
Atom Number
Bader Charge Distribution (e)
2.5
2.0
1.5
1.0
0.5
0.0
–0.5
–1.0
–1.5
0
50
100
150
200
250
300
Atom Number
Bader Charge Distribution (e)
a
b
Fig. 8 Bader charge distributions of (a) Cu/a-Ta 32 O 80 /Pt and (b) Cu/a-Ta 32 O 96 /Pt. Adapted from
Ref. [8] with permission from American Chemical Society
106
S. Watanabe and B. Xiao
simulation at 673 K, which results in the strong oxidization of these Cu atoms. This
confirms that the temperature is one of key factors to control the ionization of Cu
atoms at the Cu/a-Ta 2 O 5 interface.
3.2.2 Stability of Cu/a-Ta 2 O 5 /Pt Structure
We next examine the stability of Cu/a-Ta 2 O 5 /Pt structures with various interface O
concentrations [8]. Figure 9 shows the interface energies of the a-O8, a-O12 and
a-O16 models. It is found that the a-O12 is the most stable among the three within a
wide range of O chemical potential. As mentioned before, the content of O at the
Cu/a-Ta 2 O 5 interface is obviously higher than the other regions in the Cu/a-Ta 2 O 5 /Pt
structure. In this regard, we predicted that the Cu/a-Ta 2 O 5 structure with O-rich
interface is energetically preferable, where the Cu 2 O structure could be found.
Next, we discuss the electronic properties of Cu/a-Ta 2 O 5 /Pt heterostructure. Here,
we consider only the a-O12 model for simplicity. As seen in Fig. 10, the DOS of the
interface regions is finite around the Fermi level. This means that the interface
regions show metallic behavior, and the gap states responsible for this behavior
mainly come from the interfacial Cu-O and Pt-O bonding with a very small contribution from the interface Ta atoms as can be seen from Fig. 10. In the central region,
on the other hand, both O and Ta atoms have no contribution around Fermi level (see
Fig. 10), indicating that the central region of the a-Ta 2 O 5 is insulating. Thus, the
Cu/a-Ta 2 O 5 /Pt interface forms a Schottky contact.
3.2.3 Schottky Barrier Height of Cu/a-TaO x /Pt Structure
As we know, the Schottky barrier height (SBH) is the important quantity that should
be considered in controlling the initial set bias voltage of Cu/a-Ta 2 O 5 /Pt atomic
2.5
2.0
1.5
1.0
0.5
0.0
–0.5
–1.0
–1.5
0
Cu/a-Ta32O80/Pt
under 300K
Cu/a-Ta32O96/Pt
under 300K
Cu
Ta
O
Pt
Cu
Ta
O
Pt
Interface Ta
Interface Pt
Interface Cu
Interface O
50
100
150
200
250
300
Atom Number
Bader Charge Distribution (e)
2.5
2.0
1.5
1.0
0.5
0.0
–0.5
–1.0
–1.5
0
50
100
150
200
250
300
Atom Number
Bader Charge Distribution (e)
a
b
Fig. 8 Bader charge distributions of (a) Cu/a-Ta 32 O 80 /Pt and (b) Cu/a-Ta 32 O 96 /Pt. Adapted from
Ref. [8] with permission from American Chemical Society
106
S. Watanabe and B. Xiao