

82
J. Knapik-Kowalczuk et al.
that the excess amount of the drug re-crystallized leaving concentration that does not
display any tendency towards re-crystallization during non-isothermal studies [33].
By analysing these dielectric loss spectra the temperature dependence of the relaxation time related to the α
-relaxation (τ α (T )) can be determined (grey hexagons in
Fig. 19b).
To improve the accuracy of the VFT fitting procedure and in consequence the accuracy of the T
g s determination, the sample should be cooled down and re-measured
during heating to cover wide temperature range of the τ α (T ). Data obtained by this
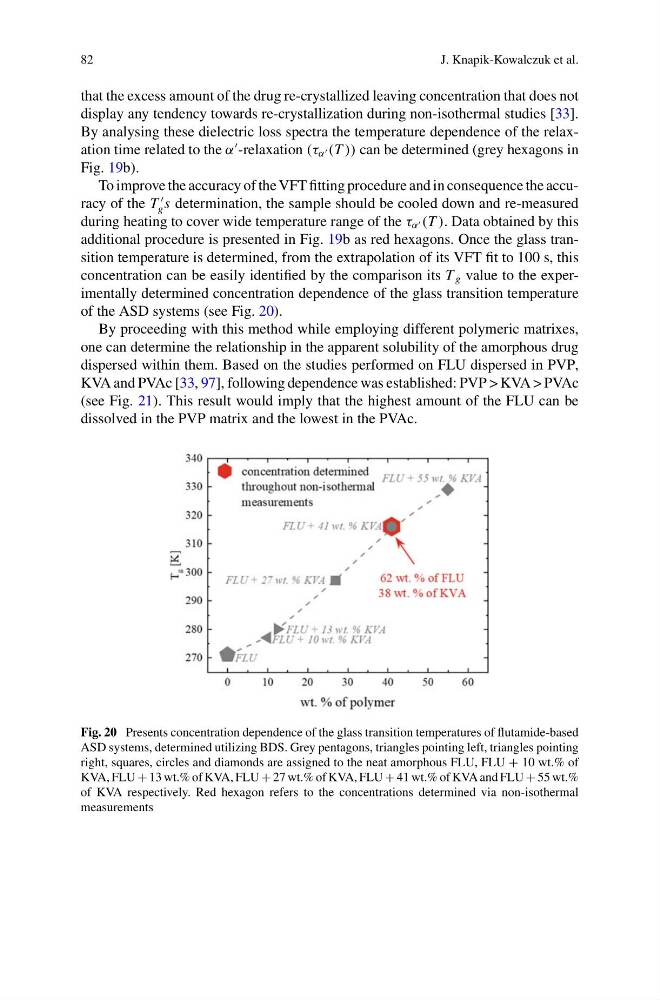
additional procedure is presented in Fig. 19b as red hexagons. Once the glass transition temperature is determined, from the extrapolation of its VFT fit to 100 s, this
concentration can be easily identified by the comparison its T g value to the experimentally determined concentration dependence of the glass transition temperature
of the ASD systems (see Fig. 20).
By proceeding with this method while employing different polymeric matrixes,
one can determine the relationship in the apparent solubility of the amorphous drug
dispersed within them. Based on the studies performed on FLU dispersed in PVP,
KVA and PVAc [33, 97], following dependence was established: PVP > KVA > PVAc
(see Fig. 21). This result would imply that the highest amount of the FLU can be
dissolved in the PVP matrix and the lowest in the PVAc.
Fig. 20 Presents concentration dependence of the glass transition temperatures of flutamide-based
ASD systems, determined utilizing BDS. Grey pentagons, triangles pointing left, triangles pointing
right, squares, circles and diamonds are assigned to the neat amorphous FLU, FLU + 10 wt.% of
KVA, FLU + 13 wt.% of KVA, FLU + 27 wt.% of KVA, FLU + 41 wt.% of KVA and FLU + 55 wt.%
of KVA respectively. Red hexagon refers to the concentrations determined via non-isothermal
measurements
J. Knapik-Kowalczuk et al.
that the excess amount of the drug re-crystallized leaving concentration that does not
display any tendency towards re-crystallization during non-isothermal studies [33].
By analysing these dielectric loss spectra the temperature dependence of the relaxation time related to the α
-relaxation (τ α (T )) can be determined (grey hexagons in
Fig. 19b).
To improve the accuracy of the VFT fitting procedure and in consequence the accuracy of the T
g s determination, the sample should be cooled down and re-measured
during heating to cover wide temperature range of the τ α (T ). Data obtained by this
additional procedure is presented in Fig. 19b as red hexagons. Once the glass transition temperature is determined, from the extrapolation of its VFT fit to 100 s, this
concentration can be easily identified by the comparison its T g value to the experimentally determined concentration dependence of the glass transition temperature
of the ASD systems (see Fig. 20).
By proceeding with this method while employing different polymeric matrixes,
one can determine the relationship in the apparent solubility of the amorphous drug
dispersed within them. Based on the studies performed on FLU dispersed in PVP,
KVA and PVAc [33, 97], following dependence was established: PVP > KVA > PVAc
(see Fig. 21). This result would imply that the highest amount of the FLU can be
dissolved in the PVP matrix and the lowest in the PVAc.
Fig. 20 Presents concentration dependence of the glass transition temperatures of flutamide-based
ASD systems, determined utilizing BDS. Grey pentagons, triangles pointing left, triangles pointing
right, squares, circles and diamonds are assigned to the neat amorphous FLU, FLU + 10 wt.% of
KVA, FLU + 13 wt.% of KVA, FLU + 27 wt.% of KVA, FLU + 41 wt.% of KVA and FLU + 55 wt.%
of KVA respectively. Red hexagon refers to the concentrations determined via non-isothermal
measurements