

Crystallization of Amorphous Pharmaceuticals at Ambient and Elevated …
81
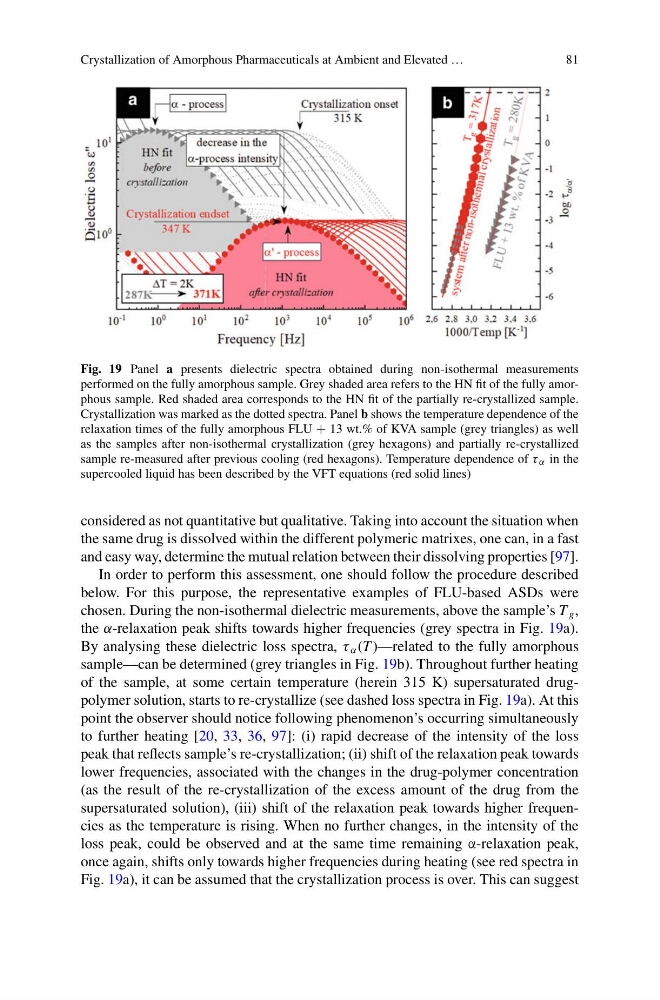
Fig. 19 Panel a presents dielectric spectra obtained during non-isothermal measurements
performed on the fully amorphous sample. Grey shaded area refers to the HN fit of the fully amorphous sample. Red shaded area corresponds to the HN fit of the partially re-crystallized sample.
Crystallization was marked as the dotted spectra. Panel b shows the temperature dependence of the
relaxation times of the fully amorphous FLU + 13 wt.% of KVA sample (grey triangles) as well
as the samples after non-isothermal crystallization (grey hexagons) and partially re-crystallized
sample re-measured after previous cooling (red hexagons). Temperature dependence of τ α in the
supercooled liquid has been described by the VFT equations (red solid lines)
considered as not quantitative but qualitative. Taking into account the situation when
the same drug is dissolved within the different polymeric matrixes, one can, in a fast
and easy way, determine the mutual relation between their dissolving properties [97].
In order to perform this assessment, one should follow the procedure described
below. For this purpose, the representative examples of FLU-based ASDs were
chosen. During the non-isothermal dielectric measurements, above the sample’s T g ,
the α-relaxation peak shifts towards higher frequencies (grey spectra in Fig. 19a).
By analysing these dielectric loss spectra, τ α (T )—related to the fully amorphous
sample—can be determined (grey triangles in Fig. 19b). Throughout further heating
of the sample, at some certain temperature (herein 315 K) supersaturated drugpolymer solution, starts to re-crystallize (see dashed loss spectra in Fig. 19a). At this
point the observer should notice following phenomenon’s occurring simultaneously
to further heating [20, 33, 36, 97]: (i) rapid decrease of the intensity of the loss
peak that reflects sample’s re-crystallization; (ii) shift of the relaxation peak towards
lower frequencies, associated with the changes in the drug-polymer concentration
(as the result of the re-crystallization of the excess amount of the drug from the
supersaturated solution), (iii) shift of the relaxation peak towards higher frequencies as the temperature is rising. When no further changes, in the intensity of the
loss peak, could be observed and at the same time remaining α-relaxation peak,
once again, shifts only towards higher frequencies during heating (see red spectra in
Fig. 19a), it can be assumed that the crystallization process is over. This can suggest
81
Fig. 19 Panel a presents dielectric spectra obtained during non-isothermal measurements
performed on the fully amorphous sample. Grey shaded area refers to the HN fit of the fully amorphous sample. Red shaded area corresponds to the HN fit of the partially re-crystallized sample.
Crystallization was marked as the dotted spectra. Panel b shows the temperature dependence of the
relaxation times of the fully amorphous FLU + 13 wt.% of KVA sample (grey triangles) as well
as the samples after non-isothermal crystallization (grey hexagons) and partially re-crystallized
sample re-measured after previous cooling (red hexagons). Temperature dependence of τ α in the
supercooled liquid has been described by the VFT equations (red solid lines)
considered as not quantitative but qualitative. Taking into account the situation when
the same drug is dissolved within the different polymeric matrixes, one can, in a fast
and easy way, determine the mutual relation between their dissolving properties [97].
In order to perform this assessment, one should follow the procedure described
below. For this purpose, the representative examples of FLU-based ASDs were
chosen. During the non-isothermal dielectric measurements, above the sample’s T g ,
the α-relaxation peak shifts towards higher frequencies (grey spectra in Fig. 19a).
By analysing these dielectric loss spectra, τ α (T )—related to the fully amorphous
sample—can be determined (grey triangles in Fig. 19b). Throughout further heating
of the sample, at some certain temperature (herein 315 K) supersaturated drugpolymer solution, starts to re-crystallize (see dashed loss spectra in Fig. 19a). At this
point the observer should notice following phenomenon’s occurring simultaneously
to further heating [20, 33, 36, 97]: (i) rapid decrease of the intensity of the loss
peak that reflects sample’s re-crystallization; (ii) shift of the relaxation peak towards
lower frequencies, associated with the changes in the drug-polymer concentration
(as the result of the re-crystallization of the excess amount of the drug from the
supersaturated solution), (iii) shift of the relaxation peak towards higher frequencies as the temperature is rising. When no further changes, in the intensity of the
loss peak, could be observed and at the same time remaining α-relaxation peak,
once again, shifts only towards higher frequencies during heating (see red spectra in
Fig. 19a), it can be assumed that the crystallization process is over. This can suggest