

Crystallization of Amorphous Pharmaceuticals at Ambient and Elevated …
65
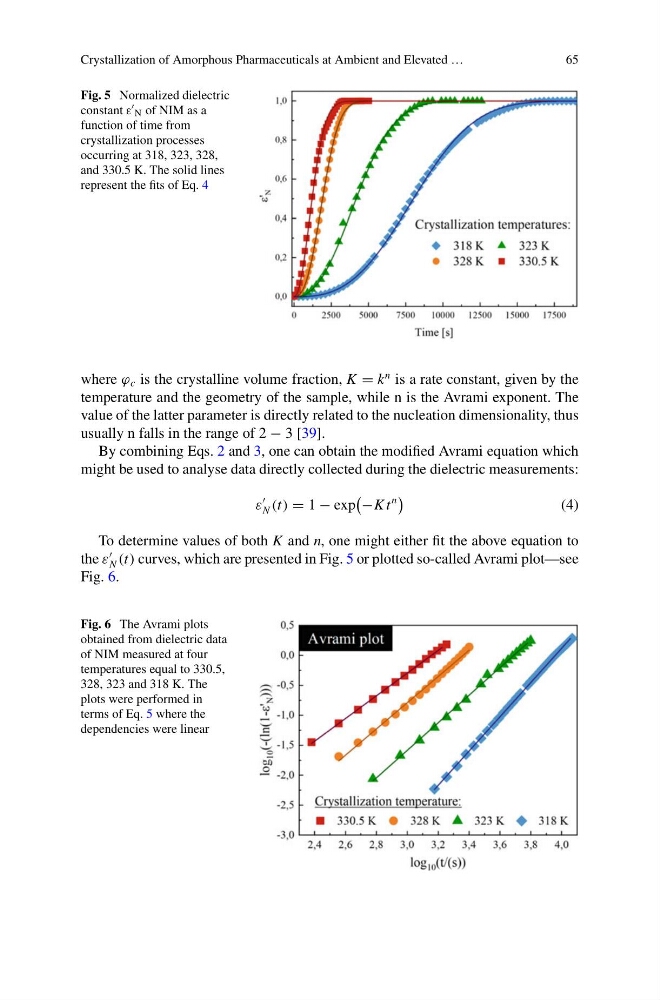
Fig. 5 Normalized dielectric
constant ε N of NIM as a
function of time from
crystallization processes
occurring at 318, 323, 328,
and 330.5 K. The solid lines
represent the fits of Eq. 4
where ϕ c is the crystalline volume fraction, K = k
n is a rate constant, given by the
temperature and the geometry of the sample, while n is the Avrami exponent. The
value of the latter parameter is directly related to the nucleation dimensionality, thus
usually n falls in the range of 2 − 3 [39].
By combining Eqs. 2 and 3, one can obtain the modified Avrami equation which
might be used to analyse data directly collected during the dielectric measurements:
ε
N (t) = 1 − exp
−K t
n
(4)
To determine values of both K and n, one might either fit the above equation to
the ε
N (t) curves, which are presented in Fig. 5 or plotted so-called Avrami plot—see
Fig. 6.
Fig. 6 The Avrami plots
obtained from dielectric data
of NIM measured at four
temperatures equal to 330.5,
328, 323 and 318 K. The
plots were performed in
terms of Eq. 5 where the
dependencies were linear
65
Fig. 5 Normalized dielectric
constant ε N of NIM as a
function of time from
crystallization processes
occurring at 318, 323, 328,
and 330.5 K. The solid lines
represent the fits of Eq. 4
where ϕ c is the crystalline volume fraction, K = k
n is a rate constant, given by the
temperature and the geometry of the sample, while n is the Avrami exponent. The
value of the latter parameter is directly related to the nucleation dimensionality, thus
usually n falls in the range of 2 − 3 [39].
By combining Eqs. 2 and 3, one can obtain the modified Avrami equation which
might be used to analyse data directly collected during the dielectric measurements:
ε
N (t) = 1 − exp
−K t
n
(4)
To determine values of both K and n, one might either fit the above equation to
the ε
N (t) curves, which are presented in Fig. 5 or plotted so-called Avrami plot—see
Fig. 6.
Fig. 6 The Avrami plots
obtained from dielectric data
of NIM measured at four
temperatures equal to 330.5,
328, 323 and 318 K. The
plots were performed in
terms of Eq. 5 where the
dependencies were linear