

66
J. Knapik-Kowalczuk et al.
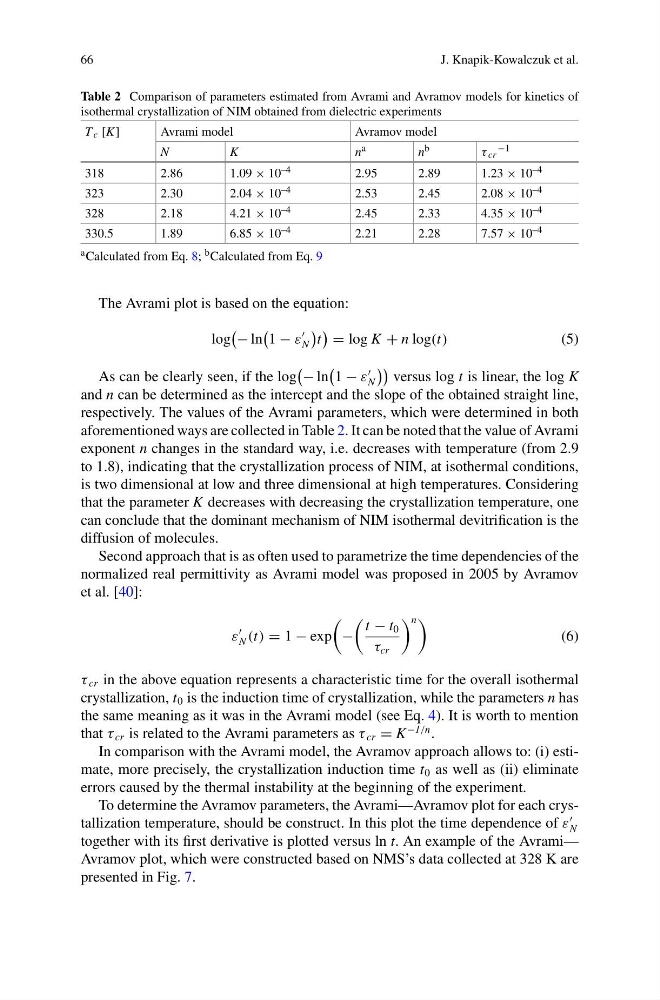
Table 2 Comparison of parameters estimated from Avrami and Avramov models for kinetics of
isothermal crystallization of NIM obtained from dielectric experiments
T c [K]
Avrami model
Avramov model
N
K
n a
n b
τ cr
−1
318
2.86
1.09 × 10 –4
2.95
2.89
1.23 × 10 –4
323
2.30
2.04 × 10 –4
2.53
2.45
2.08 × 10 –4
328
2.18
4.21 × 10 –4
2.45
2.33
4.35 × 10 –4
330.5
1.89
6.85 × 10 –4
2.21
2.28
7.57 × 10 –4
a Calculated from Eq. 8; b Calculated from Eq. 9
The Avrami plot is based on the equation:
log
− ln
1 − ε
N
t
= log K + n log(t)
(5)
As can be clearly seen, if the log
− ln
1 − ε
N
versus log t is linear, the log K
and n can be determined as the intercept and the slope of the obtained straight line,
respectively. The values of the Avrami parameters, which were determined in both
aforementioned ways are collected in Table 2. It can be noted that the value of Avrami
exponent n changes in the standard way, i.e. decreases with temperature (from 2.9
to 1.8), indicating that the crystallization process of NIM, at isothermal conditions,
is two dimensional at low and three dimensional at high temperatures. Considering
that the parameter K decreases with decreasing the crystallization temperature, one
can conclude that the dominant mechanism of NIM isothermal devitrification is the
diffusion of molecules.
Second approach that is as often used to parametrize the time dependencies of the
normalized real permittivity as Avrami model was proposed in 2005 by Avramov
et al. [40]:
ε
N (t) = 1 − exp
−
t − t 0
τ cr
n
(6)
τ cr in the above equation represents a characteristic time for the overall isothermal
crystallization, t 0 is the induction time of crystallization, while the parameters n has
the same meaning as it was in the Avrami model (see Eq. 4). It is worth to mention
that τ cr is related to the Avrami parameters as τ cr = K
−1/n .
In comparison with the Avrami model, the Avramov approach allows to: (i) estimate, more precisely, the crystallization induction time t 0 as well as (ii) eliminate
errors caused by the thermal instability at the beginning of the experiment.
To determine the Avramov parameters, the Avrami—Avramov plot for each crystallization temperature, should be construct. In this plot the time dependence of ε
N
together with its first derivative is plotted versus ln t. An example of the Avrami—
Avramov plot, which were constructed based on NMS’s data collected at 328 K are
presented in Fig. 7.
J. Knapik-Kowalczuk et al.
Table 2 Comparison of parameters estimated from Avrami and Avramov models for kinetics of
isothermal crystallization of NIM obtained from dielectric experiments
T c [K]
Avrami model
Avramov model
N
K
n a
n b
τ cr
−1
318
2.86
1.09 × 10 –4
2.95
2.89
1.23 × 10 –4
323
2.30
2.04 × 10 –4
2.53
2.45
2.08 × 10 –4
328
2.18
4.21 × 10 –4
2.45
2.33
4.35 × 10 –4
330.5
1.89
6.85 × 10 –4
2.21
2.28
7.57 × 10 –4
a Calculated from Eq. 8; b Calculated from Eq. 9
The Avrami plot is based on the equation:
log
− ln
1 − ε
N
t
= log K + n log(t)
(5)
As can be clearly seen, if the log
− ln
1 − ε
N
versus log t is linear, the log K
and n can be determined as the intercept and the slope of the obtained straight line,
respectively. The values of the Avrami parameters, which were determined in both
aforementioned ways are collected in Table 2. It can be noted that the value of Avrami
exponent n changes in the standard way, i.e. decreases with temperature (from 2.9
to 1.8), indicating that the crystallization process of NIM, at isothermal conditions,
is two dimensional at low and three dimensional at high temperatures. Considering
that the parameter K decreases with decreasing the crystallization temperature, one
can conclude that the dominant mechanism of NIM isothermal devitrification is the
diffusion of molecules.
Second approach that is as often used to parametrize the time dependencies of the
normalized real permittivity as Avrami model was proposed in 2005 by Avramov
et al. [40]:
ε
N (t) = 1 − exp
−
t − t 0
τ cr
n
(6)
τ cr in the above equation represents a characteristic time for the overall isothermal
crystallization, t 0 is the induction time of crystallization, while the parameters n has
the same meaning as it was in the Avrami model (see Eq. 4). It is worth to mention
that τ cr is related to the Avrami parameters as τ cr = K
−1/n .
In comparison with the Avrami model, the Avramov approach allows to: (i) estimate, more precisely, the crystallization induction time t 0 as well as (ii) eliminate
errors caused by the thermal instability at the beginning of the experiment.
To determine the Avramov parameters, the Avrami—Avramov plot for each crystallization temperature, should be construct. In this plot the time dependence of ε
N
together with its first derivative is plotted versus ln t. An example of the Avrami—
Avramov plot, which were constructed based on NMS’s data collected at 328 K are
presented in Fig. 7.