

44
K. Adrjanowicz
increase in the thermodynamic driving force of crystallization μ and the decrease
in the melt/crystal interface energy σ.
Isochrones are characteristic curves on the phase diagram of a liquid along
which the time scale of global/cooperative mobility remains constant. To determine isochrone, one needs to perform first dielectric relaxation studies to find the
various temperature and pressure conditions at which the position of the α-loss peak
is the same. For investigated sample which was pharmaceutical glass-formers—
indomethacin—three different combinations of temperature and pressure conditions
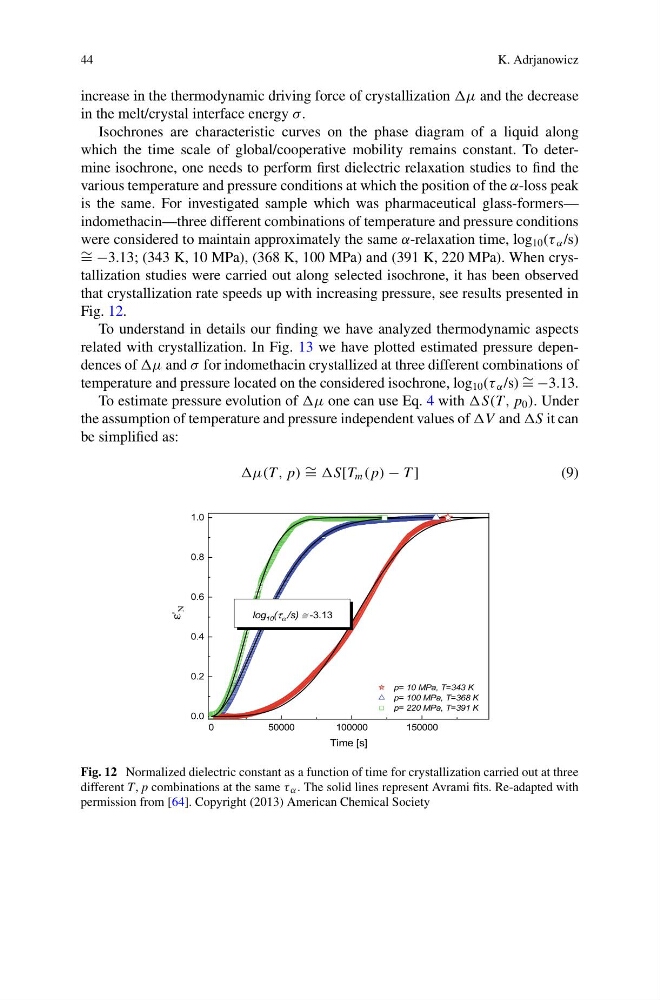
were considered to maintain approximately the same α-relaxation time, log 10 (τ α /s)
∼ = −3.13; (343 K, 10 MPa), (368 K, 100 MPa) and (391 K, 220 MPa). When crystallization studies were carried out along selected isochrone, it has been observed
that crystallization rate speeds up with increasing pressure, see results presented in
Fig. 12.
To understand in details our finding we have analyzed thermodynamic aspects
related with crystallization. In Fig. 13 we have plotted estimated pressure dependences of μ and σ for indomethacin crystallized at three different combinations of
temperature and pressure located on the considered isochrone, log 10 (τ α /s) ∼ = −3.13.
To estimate pressure evolution of μ one can use Eq. 4 with p 0 ). Under
the assumption of temperature and pressure independent values of and it can
be simplified as:
μ(T, p) ∼ = m ( p) − T ]
(9)
p= 10 MPa, T=343 K
p= 100 MPa, T=368 K
p= 220 MPa, T=391 K
0
50000
100000
150000
0.0
0.2
0.4
0.6
0.8
1.0
log 10 (τ α /s) ≅ -3.13
ε'
N
Time [s]
Fig. 12 Normalized dielectric constant as a function of time for crystallization carried out at three
different T, p combinations at the same τ α . The solid lines represent Avrami fits. Re-adapted with
permission from [64]. Copyright (2013) American Chemical Society
K. Adrjanowicz
increase in the thermodynamic driving force of crystallization μ and the decrease
in the melt/crystal interface energy σ.
Isochrones are characteristic curves on the phase diagram of a liquid along
which the time scale of global/cooperative mobility remains constant. To determine isochrone, one needs to perform first dielectric relaxation studies to find the
various temperature and pressure conditions at which the position of the α-loss peak
is the same. For investigated sample which was pharmaceutical glass-formers—
indomethacin—three different combinations of temperature and pressure conditions
were considered to maintain approximately the same α-relaxation time, log 10 (τ α /s)
∼ = −3.13; (343 K, 10 MPa), (368 K, 100 MPa) and (391 K, 220 MPa). When crystallization studies were carried out along selected isochrone, it has been observed
that crystallization rate speeds up with increasing pressure, see results presented in
Fig. 12.
To understand in details our finding we have analyzed thermodynamic aspects
related with crystallization. In Fig. 13 we have plotted estimated pressure dependences of μ and σ for indomethacin crystallized at three different combinations of
temperature and pressure located on the considered isochrone, log 10 (τ α /s) ∼ = −3.13.
To estimate pressure evolution of μ one can use Eq. 4 with p 0 ). Under
the assumption of temperature and pressure independent values of and it can
be simplified as:
μ(T, p) ∼ = m ( p) − T ]
(9)
p= 10 MPa, T=343 K
p= 100 MPa, T=368 K
p= 220 MPa, T=391 K
0
50000
100000
150000
0.0
0.2
0.4
0.6
0.8
1.0
log 10 (τ α /s) ≅ -3.13
ε'
N
Time [s]
Fig. 12 Normalized dielectric constant as a function of time for crystallization carried out at three
different T, p combinations at the same τ α . The solid lines represent Avrami fits. Re-adapted with
permission from [64]. Copyright (2013) American Chemical Society