

274
M. Tress et al.
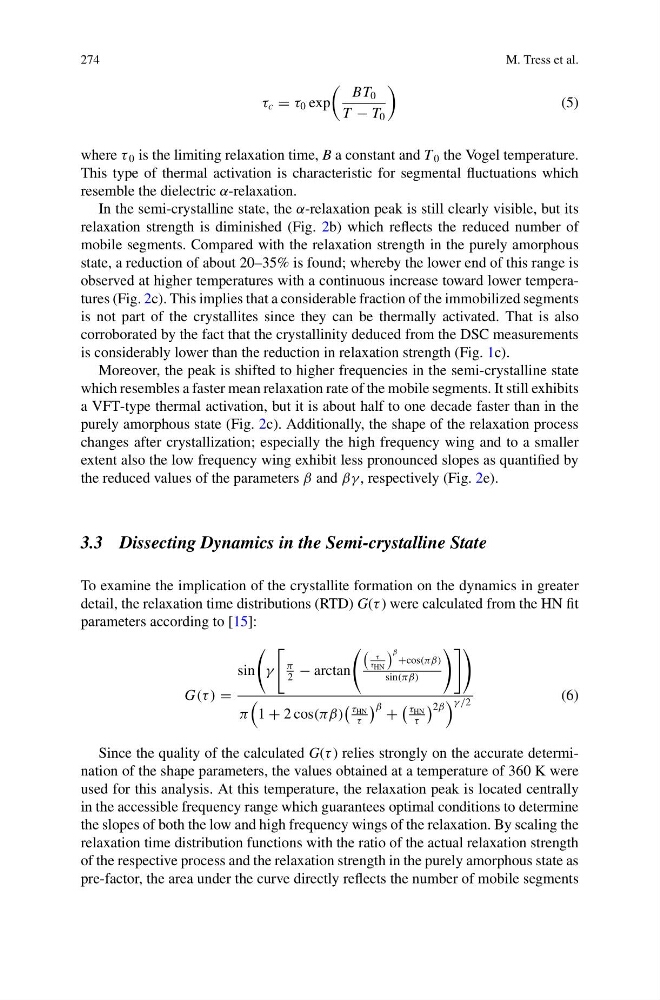
τ c = τ 0 exp
BT 0
T − T 0
(5)
where τ 0 is the limiting relaxation time, B a constant and T 0 the Vogel temperature.
This type of thermal activation is characteristic for segmental fluctuations which
resemble the dielectric α-relaxation.
In the semi-crystalline state, the α-relaxation peak is still clearly visible, but its
relaxation strength is diminished (Fig. 2b) which reflects the reduced number of
mobile segments. Compared with the relaxation strength in the purely amorphous
state, a reduction of about 20–35% is found; whereby the lower end of this range is
observed at higher temperatures with a continuous increase toward lower temperatures (Fig. 2c). This implies that a considerable fraction of the immobilized segments
is not part of the crystallites since they can be thermally activated. That is also
corroborated by the fact that the crystallinity deduced from the DSC measurements
is considerably lower than the reduction in relaxation strength (Fig. 1c).
Moreover, the peak is shifted to higher frequencies in the semi-crystalline state
which resembles a faster mean relaxation rate of the mobile segments. It still exhibits
a VFT-type thermal activation, but it is about half to one decade faster than in the
purely amorphous state (Fig. 2c). Additionally, the shape of the relaxation process
changes after crystallization; especially the high frequency wing and to a smaller
extent also the low frequency wing exhibit less pronounced slopes as quantified by
the reduced values of the parameters β and βγ , respectively (Fig. 2e).
3.3 Dissecting Dynamics in the Semi-crystalline State
To examine the implication of the crystallite formation on the dynamics in greater
detail, the relaxation time distributions (RTD) G(τ ) were calculated from the HN fit
parameters according to [15]:
G(τ ) =
sin
γ
π
2
− arctan
τ
τ HN
β +cos(πβ)
sin(πβ)
π
1 + 2 cos(πβ)
τ HN
τ
β +
τ HN
τ
2β
γ /2
(6)
Since the quality of the calculated G(τ ) relies strongly on the accurate determination of the shape parameters, the values obtained at a temperature of 360 K were
used for this analysis. At this temperature, the relaxation peak is located centrally
in the accessible frequency range which guarantees optimal conditions to determine
the slopes of both the low and high frequency wings of the relaxation. By scaling the
relaxation time distribution functions with the ratio of the actual relaxation strength
of the respective process and the relaxation strength in the purely amorphous state as
pre-factor, the area under the curve directly reflects the number of mobile segments
M. Tress et al.
τ c = τ 0 exp
BT 0
T − T 0
(5)
where τ 0 is the limiting relaxation time, B a constant and T 0 the Vogel temperature.
This type of thermal activation is characteristic for segmental fluctuations which
resemble the dielectric α-relaxation.
In the semi-crystalline state, the α-relaxation peak is still clearly visible, but its
relaxation strength is diminished (Fig. 2b) which reflects the reduced number of
mobile segments. Compared with the relaxation strength in the purely amorphous
state, a reduction of about 20–35% is found; whereby the lower end of this range is
observed at higher temperatures with a continuous increase toward lower temperatures (Fig. 2c). This implies that a considerable fraction of the immobilized segments
is not part of the crystallites since they can be thermally activated. That is also
corroborated by the fact that the crystallinity deduced from the DSC measurements
is considerably lower than the reduction in relaxation strength (Fig. 1c).
Moreover, the peak is shifted to higher frequencies in the semi-crystalline state
which resembles a faster mean relaxation rate of the mobile segments. It still exhibits
a VFT-type thermal activation, but it is about half to one decade faster than in the
purely amorphous state (Fig. 2c). Additionally, the shape of the relaxation process
changes after crystallization; especially the high frequency wing and to a smaller
extent also the low frequency wing exhibit less pronounced slopes as quantified by
the reduced values of the parameters β and βγ , respectively (Fig. 2e).
3.3 Dissecting Dynamics in the Semi-crystalline State
To examine the implication of the crystallite formation on the dynamics in greater
detail, the relaxation time distributions (RTD) G(τ ) were calculated from the HN fit
parameters according to [15]:
G(τ ) =
sin
γ
π
2
− arctan
τ
τ HN
β +cos(πβ)
sin(πβ)
π
1 + 2 cos(πβ)
τ HN
τ
β +
τ HN
τ
2β
γ /2
(6)
Since the quality of the calculated G(τ ) relies strongly on the accurate determination of the shape parameters, the values obtained at a temperature of 360 K were
used for this analysis. At this temperature, the relaxation peak is located centrally
in the accessible frequency range which guarantees optimal conditions to determine
the slopes of both the low and high frequency wings of the relaxation. By scaling the
relaxation time distribution functions with the ratio of the actual relaxation strength
of the respective process and the relaxation strength in the purely amorphous state as
pre-factor, the area under the curve directly reflects the number of mobile segments