

Confined Glassy Dynamics in a Star-Shaped Polymer …
273
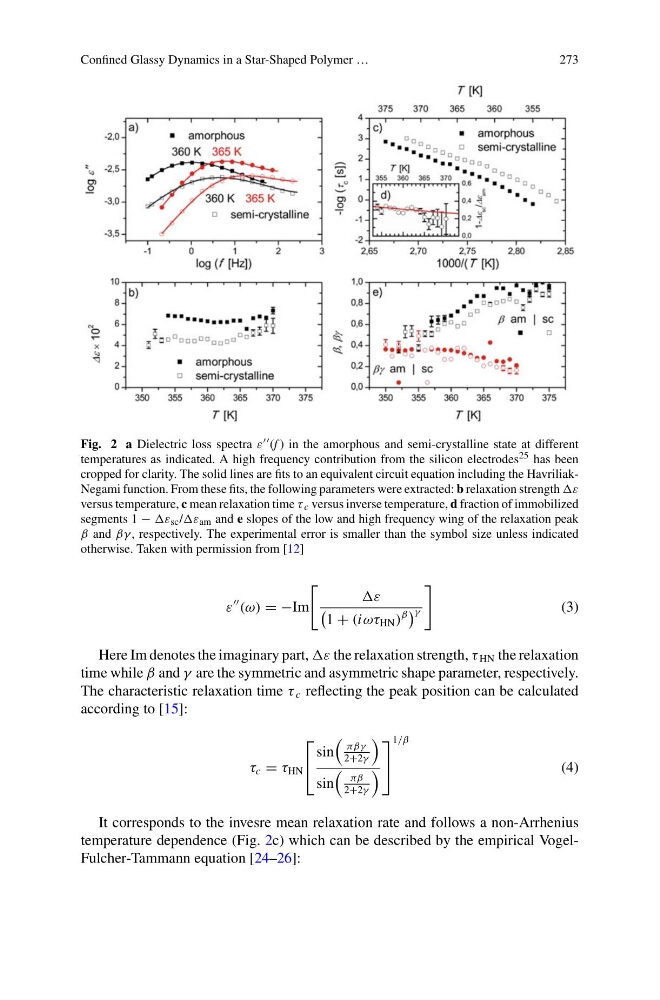
Fig. 2 a Dielectric loss spectra ε (f ) in the amorphous and semi-crystalline state at different
temperatures as indicated. A high frequency contribution from the silicon electrodes 25 has been
cropped for clarity. The solid lines are fits to an equivalent circuit equation including the HavriliakNegami function. From these fits, the following parameters were extracted: b relaxation strength ε
versus temperature, c mean relaxation time τ c versus inverse temperature, d fraction of immobilized
segments 1 − ε sc /ε am and e slopes of the low and high frequency wing of the relaxation peak
β and βγ , respectively. The experimental error is smaller than the symbol size unless indicated
otherwise. Taken with permission from [12]
ε
(ω) = −Im
ε
1 + (iωτ HN )
β
γ
(3)
Here Im denotes the imaginary part, ε the relaxation strength, τ HN the relaxation
time while β and γ are the symmetric and asymmetric shape parameter, respectively.
The characteristic relaxation time τ c reflecting the peak position can be calculated
according to [15]:
τ c = τ HN
⎡
⎣
sin
πβγ
2+2γ
sin
πβ
2+2γ
⎤
⎦
1/β
(4)
It corresponds to the invesre mean relaxation rate and follows a non-Arrhenius
temperature dependence (Fig. 2c) which can be described by the empirical VogelFulcher-Tammann equation [24–26]:
273
Fig. 2 a Dielectric loss spectra ε (f ) in the amorphous and semi-crystalline state at different
temperatures as indicated. A high frequency contribution from the silicon electrodes 25 has been
cropped for clarity. The solid lines are fits to an equivalent circuit equation including the HavriliakNegami function. From these fits, the following parameters were extracted: b relaxation strength ε
versus temperature, c mean relaxation time τ c versus inverse temperature, d fraction of immobilized
segments 1 − ε sc /ε am and e slopes of the low and high frequency wing of the relaxation peak
β and βγ , respectively. The experimental error is smaller than the symbol size unless indicated
otherwise. Taken with permission from [12]
ε
(ω) = −Im
ε
1 + (iωτ HN )
β
γ
(3)
Here Im denotes the imaginary part, ε the relaxation strength, τ HN the relaxation
time while β and γ are the symmetric and asymmetric shape parameter, respectively.
The characteristic relaxation time τ c reflecting the peak position can be calculated
according to [15]:
τ c = τ HN
⎡
⎣
sin
πβγ
2+2γ
sin
πβ
2+2γ
⎤
⎦
1/β
(4)
It corresponds to the invesre mean relaxation rate and follows a non-Arrhenius
temperature dependence (Fig. 2c) which can be described by the empirical VogelFulcher-Tammann equation [24–26]: