

272
M. Tress et al.
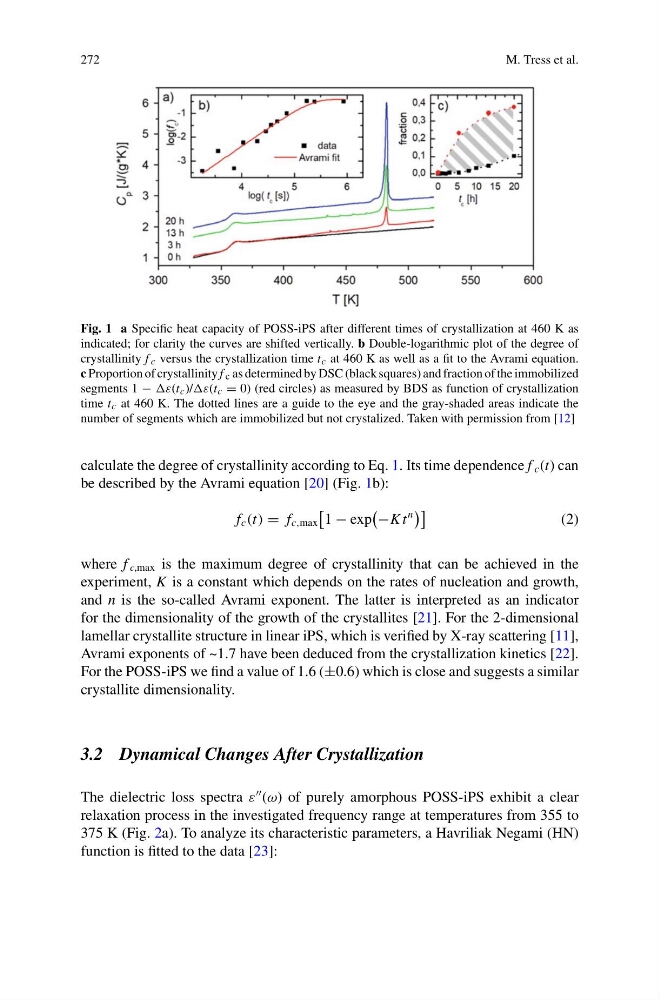
Fig. 1 a Specific heat capacity of POSS-iPS after different times of crystallization at 460 K as
indicated; for clarity the curves are shifted vertically. b Double-logarithmic plot of the degree of
crystallinity f c versus the crystallization time t c at 460 K as well as a fit to the Avrami equation.
c Proportion of crystallinity f c as determined by DSC (black squares) and fraction of the immobilized
segments 1 − ε(t c )/ε(t c = 0) (red circles) as measured by BDS as function of crystallization
time t c at 460 K. The dotted lines are a guide to the eye and the gray-shaded areas indicate the
number of segments which are immobilized but not crystalized. Taken with permission from [12]
calculate the degree of crystallinity according to Eq. 1. Its time dependence f c (t) can
be described by the Avrami equation [20] (Fig. 1b):
f c (t) = f c,max
1 − exp
−K t
n
(2)
where f c,max is the maximum degree of crystallinity that can be achieved in the
experiment, K is a constant which depends on the rates of nucleation and growth,
and n is the so-called Avrami exponent. The latter is interpreted as an indicator
for the dimensionality of the growth of the crystallites [21]. For the 2-dimensional
lamellar crystallite structure in linear iPS, which is verified by X-ray scattering [11],
Avrami exponents of ~1.7 have been deduced from the crystallization kinetics [22].
For the POSS-iPS we find a value of 1.6 (±0.6) which is close and suggests a similar
crystallite dimensionality.
3.2 Dynamical Changes After Crystallization
The dielectric loss spectra ε
(ω) of purely amorphous POSS-iPS exhibit a clear
relaxation process in the investigated frequency range at temperatures from 355 to
375 K (Fig. 2a). To analyze its characteristic parameters, a Havriliak Negami (HN)
function is fitted to the data [23]:
M. Tress et al.
Fig. 1 a Specific heat capacity of POSS-iPS after different times of crystallization at 460 K as
indicated; for clarity the curves are shifted vertically. b Double-logarithmic plot of the degree of
crystallinity f c versus the crystallization time t c at 460 K as well as a fit to the Avrami equation.
c Proportion of crystallinity f c as determined by DSC (black squares) and fraction of the immobilized
segments 1 − ε(t c )/ε(t c = 0) (red circles) as measured by BDS as function of crystallization
time t c at 460 K. The dotted lines are a guide to the eye and the gray-shaded areas indicate the
number of segments which are immobilized but not crystalized. Taken with permission from [12]
calculate the degree of crystallinity according to Eq. 1. Its time dependence f c (t) can
be described by the Avrami equation [20] (Fig. 1b):
f c (t) = f c,max
1 − exp
−K t
n
(2)
where f c,max is the maximum degree of crystallinity that can be achieved in the
experiment, K is a constant which depends on the rates of nucleation and growth,
and n is the so-called Avrami exponent. The latter is interpreted as an indicator
for the dimensionality of the growth of the crystallites [21]. For the 2-dimensional
lamellar crystallite structure in linear iPS, which is verified by X-ray scattering [11],
Avrami exponents of ~1.7 have been deduced from the crystallization kinetics [22].
For the POSS-iPS we find a value of 1.6 (±0.6) which is close and suggests a similar
crystallite dimensionality.
3.2 Dynamical Changes After Crystallization
The dielectric loss spectra ε
(ω) of purely amorphous POSS-iPS exhibit a clear
relaxation process in the investigated frequency range at temperatures from 355 to
375 K (Fig. 2a). To analyze its characteristic parameters, a Havriliak Negami (HN)
function is fitted to the data [23]: