

Dielectric Behavior of Nonpolar Polymers and Their Composites …
251
10
-1
10
0
10
1
10
2
10
3
10
4
10
5
10
6
10
-3
10
-2
10
-1
173.5 s
520.5 s
867.5 s
1214.5 s
1561.5 s
1908.5 s
2255.5 s
2602.5 s
2949.5 s
3296.5 s
3643.5 s
ε''
f (Hz)
Formation of Entanglements
with increasing time
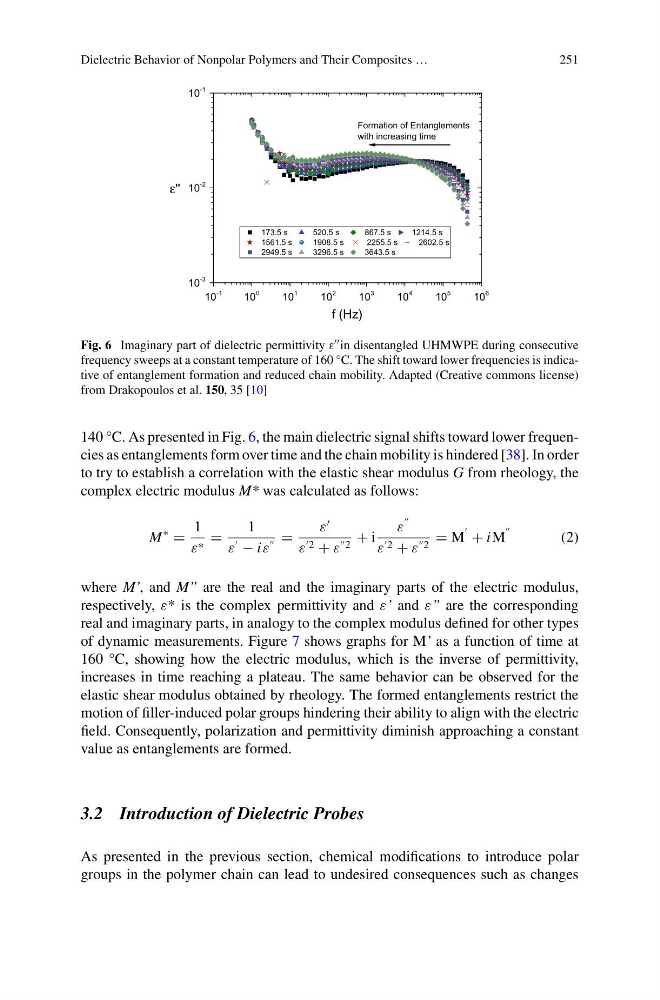
Fig. 6 Imaginary part of dielectric permittivity ε in disentangled UHMWPE during consecutive
frequency sweeps at a constant temperature of 160 °C. The shift toward lower frequencies is indicative of entanglement formation and reduced chain mobility. Adapted (Creative commons license)
from Drakopoulos et al. 150, 35 [10]
140 °C. As presented in Fig. 6, the main dielectric signal shifts toward lower frequencies as entanglements form over time and the chain mobility is hindered [38]. In order
to try to establish a correlation with the elastic shear modulus G from rheology, the
complex electric modulus M* was calculated as follows:
M
∗
=
1
ε ∗ =
1
ε
− iε
=
ε
ε
2 + ε
2
+ i
ε
ε
2 + ε
2
= M
+ iM
(2)
where M’, and M” are the real and the imaginary parts of the electric modulus,
respectively, ε* is the complex permittivity and ε’ and ε” are the corresponding
real and imaginary parts, in analogy to the complex modulus defined for other types
of dynamic measurements. Figure 7 shows graphs for M’ as a function of time at
160 °C, showing how the electric modulus, which is the inverse of permittivity,
increases in time reaching a plateau. The same behavior can be observed for the
elastic shear modulus obtained by rheology. The formed entanglements restrict the
motion of filler-induced polar groups hindering their ability to align with the electric
field. Consequently, polarization and permittivity diminish approaching a constant
value as entanglements are formed.
3.2 Introduction of Dielectric Probes
As presented in the previous section, chemical modifications to introduce polar
groups in the polymer chain can lead to undesired consequences such as changes
251
10
-1
10
0
10
1
10
2
10
3
10
4
10
5
10
6
10
-3
10
-2
10
-1
173.5 s
520.5 s
867.5 s
1214.5 s
1561.5 s
1908.5 s
2255.5 s
2602.5 s
2949.5 s
3296.5 s
3643.5 s
ε''
f (Hz)
Formation of Entanglements
with increasing time
Fig. 6 Imaginary part of dielectric permittivity ε in disentangled UHMWPE during consecutive
frequency sweeps at a constant temperature of 160 °C. The shift toward lower frequencies is indicative of entanglement formation and reduced chain mobility. Adapted (Creative commons license)
from Drakopoulos et al. 150, 35 [10]
140 °C. As presented in Fig. 6, the main dielectric signal shifts toward lower frequencies as entanglements form over time and the chain mobility is hindered [38]. In order
to try to establish a correlation with the elastic shear modulus G from rheology, the
complex electric modulus M* was calculated as follows:
M
∗
=
1
ε ∗ =
1
ε
− iε
=
ε
ε
2 + ε
2
+ i
ε
ε
2 + ε
2
= M
+ iM
(2)
where M’, and M” are the real and the imaginary parts of the electric modulus,
respectively, ε* is the complex permittivity and ε’ and ε” are the corresponding
real and imaginary parts, in analogy to the complex modulus defined for other types
of dynamic measurements. Figure 7 shows graphs for M’ as a function of time at
160 °C, showing how the electric modulus, which is the inverse of permittivity,
increases in time reaching a plateau. The same behavior can be observed for the
elastic shear modulus obtained by rheology. The formed entanglements restrict the
motion of filler-induced polar groups hindering their ability to align with the electric
field. Consequently, polarization and permittivity diminish approaching a constant
value as entanglements are formed.
3.2 Introduction of Dielectric Probes
As presented in the previous section, chemical modifications to introduce polar
groups in the polymer chain can lead to undesired consequences such as changes