

214
A. Nogales et al.
can be prepared. Subsequently, the elongated sample can be glued either to a goldplated electrode for BDS measurements, or to a metallic frame for the X-ray scattering
experiments. Finally, the stretched sample-electrode set can be detached from the
dynamometer clamps. As mentioned above, vulcanized NR only exhibits above T g
the characteristic α-relaxation because the normal mode has been suppressed by
the cross-linking induced by vulcanization. Therefore in order to assess the effect of
stretching on the segmental dynamics of vulcanized NR the BDS experiments can be
accomplished at a temperature at which the α-relaxation is well centered within the
frequency window measured. As an example Fig. 13b shows dielectric loss spectra
as measured at T = −40
° C for vulcanized NR at the different strain ratios. The
dielectric loss data for different stretch ratios can be well fitted according to HN
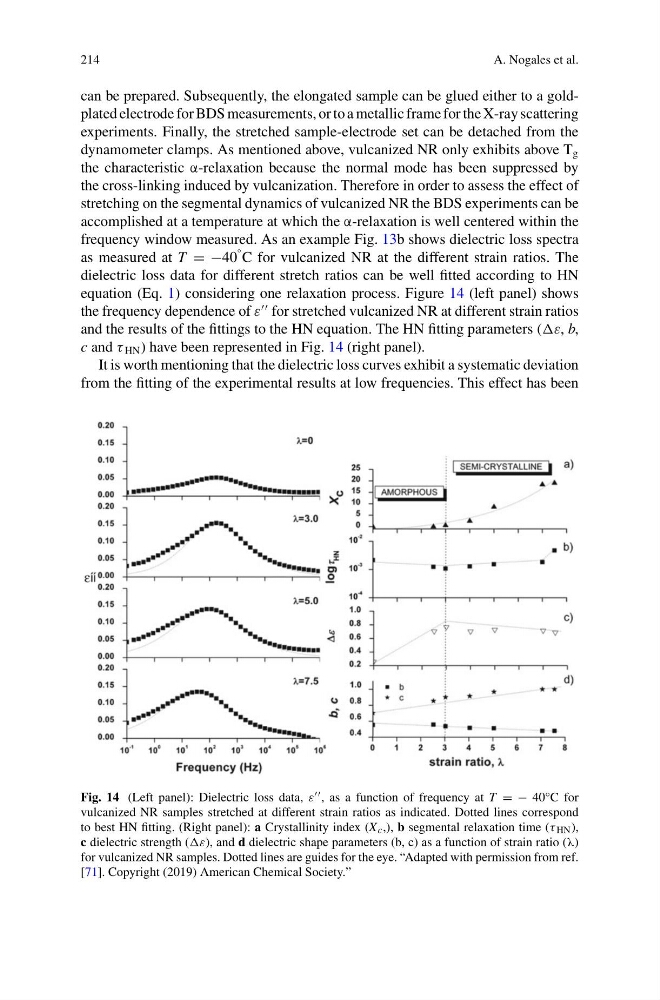
equation (Eq. 1) considering one relaxation process. Figure 14 (left panel) shows
the frequency dependence of ε
for stretched vulcanized NR at different strain ratios
and the results of the fittings to the HN equation. The HN fitting parameters (ε, b,
c and τ HN ) have been represented in Fig. 14 (right panel).
It is worth mentioning that the dielectric loss curves exhibit a systematic deviation
from the fitting of the experimental results at low frequencies. This effect has been
Fig. 14 (Left panel): Dielectric loss data, ε , as a function of frequency at T = − 40°C for
vulcanized NR samples stretched at different strain ratios as indicated. Dotted lines correspond
to best HN fitting. (Right panel): a Crystallinity index (X c ,), b segmental relaxation time (τ HN ),
c dielectric strength (ε), and d dielectric shape parameters (b, c) as a function of strain ratio (λ)
for vulcanized NR samples. Dotted lines are guides for the eye. “Adapted with permission from ref.
[71]. Copyright (2019) American Chemical Society.”
A. Nogales et al.
can be prepared. Subsequently, the elongated sample can be glued either to a goldplated electrode for BDS measurements, or to a metallic frame for the X-ray scattering
experiments. Finally, the stretched sample-electrode set can be detached from the
dynamometer clamps. As mentioned above, vulcanized NR only exhibits above T g
the characteristic α-relaxation because the normal mode has been suppressed by
the cross-linking induced by vulcanization. Therefore in order to assess the effect of
stretching on the segmental dynamics of vulcanized NR the BDS experiments can be
accomplished at a temperature at which the α-relaxation is well centered within the
frequency window measured. As an example Fig. 13b shows dielectric loss spectra
as measured at T = −40
° C for vulcanized NR at the different strain ratios. The
dielectric loss data for different stretch ratios can be well fitted according to HN
equation (Eq. 1) considering one relaxation process. Figure 14 (left panel) shows
the frequency dependence of ε
for stretched vulcanized NR at different strain ratios
and the results of the fittings to the HN equation. The HN fitting parameters (ε, b,
c and τ HN ) have been represented in Fig. 14 (right panel).
It is worth mentioning that the dielectric loss curves exhibit a systematic deviation
from the fitting of the experimental results at low frequencies. This effect has been
Fig. 14 (Left panel): Dielectric loss data, ε , as a function of frequency at T = − 40°C for
vulcanized NR samples stretched at different strain ratios as indicated. Dotted lines correspond
to best HN fitting. (Right panel): a Crystallinity index (X c ,), b segmental relaxation time (τ HN ),
c dielectric strength (ε), and d dielectric shape parameters (b, c) as a function of strain ratio (λ)
for vulcanized NR samples. Dotted lines are guides for the eye. “Adapted with permission from ref.
[71]. Copyright (2019) American Chemical Society.”