

212
A. Nogales et al.
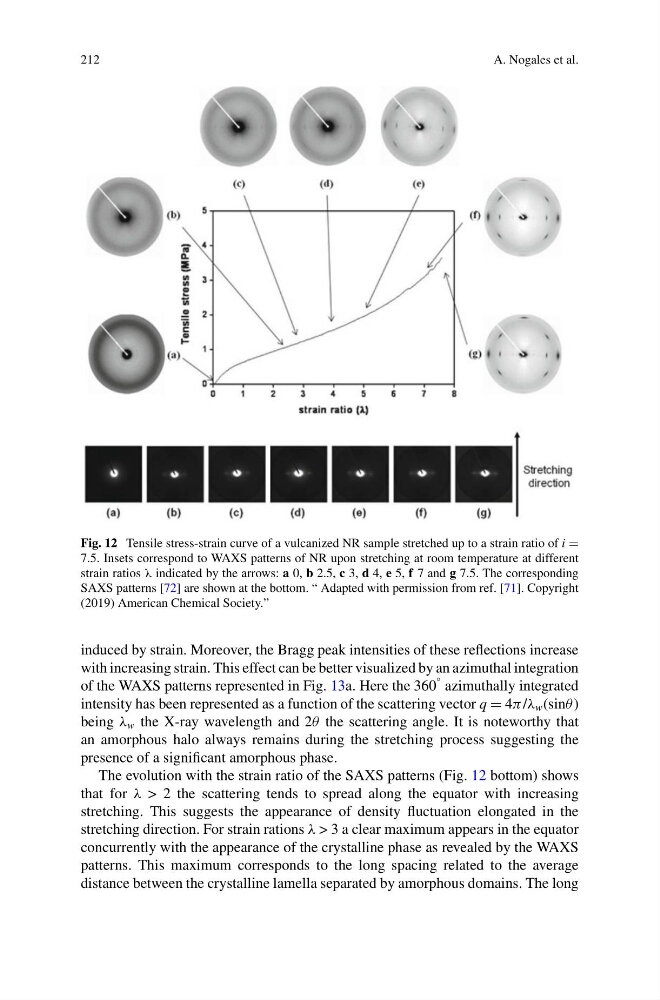
Fig. 12 Tensile stress-strain curve of a vulcanized NR sample stretched up to a strain ratio of i =
7.5. Insets correspond to WAXS patterns of NR upon stretching at room temperature at different
strain ratios λ indicated by the arrows: a 0, b 2.5, c 3, d 4, e 5, f 7 and g 7.5. The corresponding
SAXS patterns [72] are shown at the bottom. “ Adapted with permission from ref. [71]. Copyright
(2019) American Chemical Society.”
induced by strain. Moreover, the Bragg peak intensities of these reflections increase
with increasing strain. This effect can be better visualized by an azimuthal integration
of the WAXS patterns represented in Fig. 13a. Here the 360
° azimuthally integrated
intensity has been represented as a function of the scattering vector q = 4π /λ w (sinθ )
being λ w the X-ray wavelength and 2θ the scattering angle. It is noteworthy that
an amorphous halo always remains during the stretching process suggesting the
presence of a significant amorphous phase.
The evolution with the strain ratio of the SAXS patterns (Fig. 12 bottom) shows
that for λ > 2 the scattering tends to spread along the equator with increasing
stretching. This suggests the appearance of density fluctuation elongated in the
stretching direction. For strain rations λ > 3 a clear maximum appears in the equator
concurrently with the appearance of the crystalline phase as revealed by the WAXS
patterns. This maximum corresponds to the long spacing related to the average
distance between the crystalline lamella separated by amorphous domains. The long
A. Nogales et al.
Fig. 12 Tensile stress-strain curve of a vulcanized NR sample stretched up to a strain ratio of i =
7.5. Insets correspond to WAXS patterns of NR upon stretching at room temperature at different
strain ratios λ indicated by the arrows: a 0, b 2.5, c 3, d 4, e 5, f 7 and g 7.5. The corresponding
SAXS patterns [72] are shown at the bottom. “ Adapted with permission from ref. [71]. Copyright
(2019) American Chemical Society.”
induced by strain. Moreover, the Bragg peak intensities of these reflections increase
with increasing strain. This effect can be better visualized by an azimuthal integration
of the WAXS patterns represented in Fig. 13a. Here the 360
° azimuthally integrated
intensity has been represented as a function of the scattering vector q = 4π /λ w (sinθ )
being λ w the X-ray wavelength and 2θ the scattering angle. It is noteworthy that
an amorphous halo always remains during the stretching process suggesting the
presence of a significant amorphous phase.
The evolution with the strain ratio of the SAXS patterns (Fig. 12 bottom) shows
that for λ > 2 the scattering tends to spread along the equator with increasing
stretching. This suggests the appearance of density fluctuation elongated in the
stretching direction. For strain rations λ > 3 a clear maximum appears in the equator
concurrently with the appearance of the crystalline phase as revealed by the WAXS
patterns. This maximum corresponds to the long spacing related to the average
distance between the crystalline lamella separated by amorphous domains. The long