

186
S. Cerveny and J. Swenson
from the fittings. It can there be seen that the water relaxation time is unaffected by
crystallization and correspondingly the crossover from the high-temperature nonArrhenius behavior to the low-temperature Arrhenius dependence is obtained at
the same temperature (approximately T g ) for the amorphous and semi-crystalline
materials.
Regarding the ice relaxation, Fig. 13b compares the temperature dependence
of the relaxation times of bulk ice [49], ice in solutions of bovine serum albumin
(BSA) [50], collagen [52], and 3PG water solutions. We can observe that there is
no difference in the relaxation times between solutions of proteins and 3PG, but the
relaxation of bulk ice is different, as discussed in other publications [50–52].
We now present the results for samples crystallized at a high crystallization
temperature (i.e., fast crystallization). As an example, we show the case for PVME
(c w = 50 wt%) using T cryst = 210 K. In this case, the glass transition temperature of
the amorphous (190 K) and semi-crystalline (200 K) materials changes by ~10 K (see
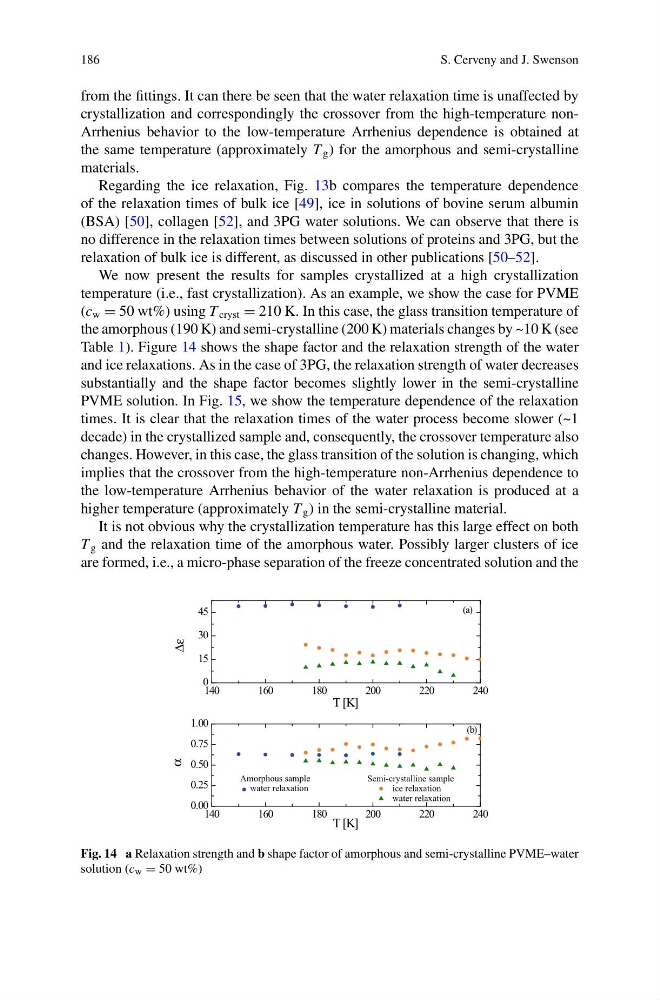
Table 1). Figure 14 shows the shape factor and the relaxation strength of the water
and ice relaxations. As in the case of 3PG, the relaxation strength of water decreases
substantially and the shape factor becomes slightly lower in the semi-crystalline
PVME solution. In Fig. 15, we show the temperature dependence of the relaxation
times. It is clear that the relaxation times of the water process become slower (~1
decade) in the crystallized sample and, consequently, the crossover temperature also
changes. However, in this case, the glass transition of the solution is changing, which
implies that the crossover from the high-temperature non-Arrhenius dependence to
the low-temperature Arrhenius behavior of the water relaxation is produced at a
higher temperature (approximately T g ) in the semi-crystalline material.
It is not obvious why the crystallization temperature has this large effect on both
T g and the relaxation time of the amorphous water. Possibly larger clusters of ice
are formed, i.e., a micro-phase separation of the freeze concentrated solution and the
140
160
180
200
220
240
0
15
30
45
140
160
180
200
220
240
0.00
0.25
0.50
0.75
1.00
(a)
Δε
T [K]
(b)
Semi-crystalline sample
Amorphous sample
ice relaxation
water relaxation
α
T [K]
water relaxation
Fig. 14 a Relaxation strength and b shape factor of amorphous and semi-crystalline PVME–water
solution (c w = 50 wt%)
S. Cerveny and J. Swenson
from the fittings. It can there be seen that the water relaxation time is unaffected by
crystallization and correspondingly the crossover from the high-temperature nonArrhenius behavior to the low-temperature Arrhenius dependence is obtained at
the same temperature (approximately T g ) for the amorphous and semi-crystalline
materials.
Regarding the ice relaxation, Fig. 13b compares the temperature dependence
of the relaxation times of bulk ice [49], ice in solutions of bovine serum albumin
(BSA) [50], collagen [52], and 3PG water solutions. We can observe that there is
no difference in the relaxation times between solutions of proteins and 3PG, but the
relaxation of bulk ice is different, as discussed in other publications [50–52].
We now present the results for samples crystallized at a high crystallization
temperature (i.e., fast crystallization). As an example, we show the case for PVME
(c w = 50 wt%) using T cryst = 210 K. In this case, the glass transition temperature of
the amorphous (190 K) and semi-crystalline (200 K) materials changes by ~10 K (see
Table 1). Figure 14 shows the shape factor and the relaxation strength of the water
and ice relaxations. As in the case of 3PG, the relaxation strength of water decreases
substantially and the shape factor becomes slightly lower in the semi-crystalline
PVME solution. In Fig. 15, we show the temperature dependence of the relaxation
times. It is clear that the relaxation times of the water process become slower (~1
decade) in the crystallized sample and, consequently, the crossover temperature also
changes. However, in this case, the glass transition of the solution is changing, which
implies that the crossover from the high-temperature non-Arrhenius dependence to
the low-temperature Arrhenius behavior of the water relaxation is produced at a
higher temperature (approximately T g ) in the semi-crystalline material.
It is not obvious why the crystallization temperature has this large effect on both
T g and the relaxation time of the amorphous water. Possibly larger clusters of ice
are formed, i.e., a micro-phase separation of the freeze concentrated solution and the
140
160
180
200
220
240
0
15
30
45
140
160
180
200
220
240
0.00
0.25
0.50
0.75
1.00
(a)
Δε
T [K]
(b)
Semi-crystalline sample
Amorphous sample
ice relaxation
water relaxation
α
T [K]
water relaxation
Fig. 14 a Relaxation strength and b shape factor of amorphous and semi-crystalline PVME–water
solution (c w = 50 wt%)