

Dynamics of Water in Partially Crystallized Solutions of Glass …
185
140
150
160
170
180
190
200
210
0
10
20
30
40
50
150
160
170
180
190
200
210
0.0
0.2
0.4
0.6
0.8
1.0
(a)
3PG, c w = 50 wt%
Δε
T [K]
(b)
water relaxation
Semi-crystalline sample
Amorphous sample
α
T [K]
ice relaxation
water relaxation
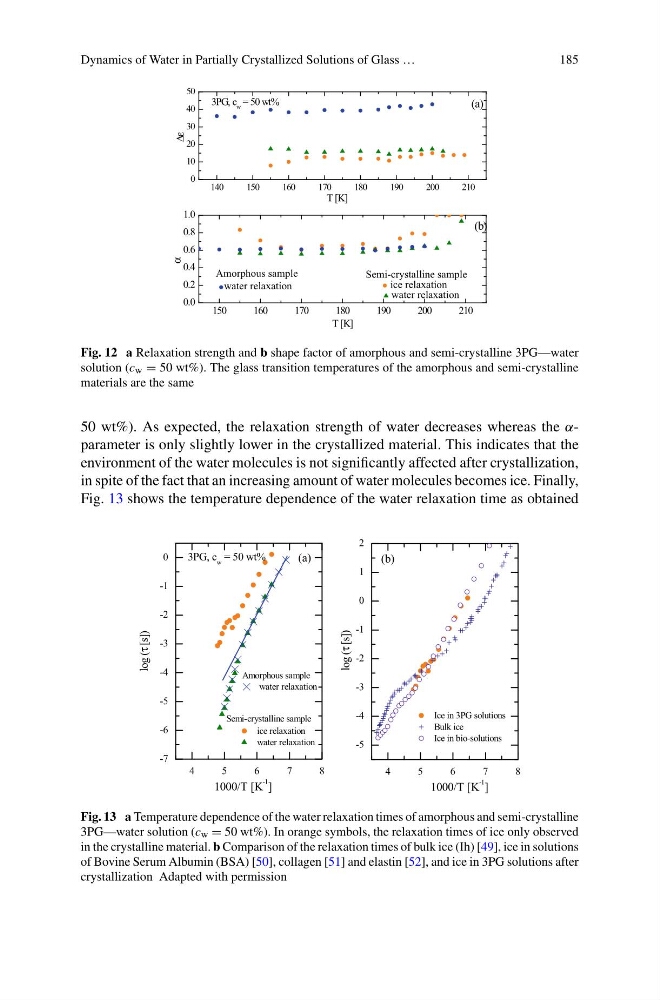
Fig. 12 a Relaxation strength and b shape factor of amorphous and semi-crystalline 3PG—water
solution (c w = 50 wt%). The glass transition temperatures of the amorphous and semi-crystalline
materials are the same
50 wt%). As expected, the relaxation strength of water decreases whereas the αparameter is only slightly lower in the crystallized material. This indicates that the
environment of the water molecules is not significantly affected after crystallization,
in spite of the fact that an increasing amount of water molecules becomes ice. Finally,
Fig. 13 shows the temperature dependence of the water relaxation time as obtained
4
5
6
7
8
-5
-4
-3
-2
-1
0
1
2
4
5
6
7
8
-7
-6
-5
-4
-3
-2
-1
0
(b)
1000/T [K
-1
]
Ice in 3PG solutions
Bulk ice
Ice in bio-solutions
(a)
1000/T [K
-1
]
ice relaxation
water relaxation
Amorphous sample
Semi-crystalline sample
3PG, c w = 50 wt%
water relaxation
log (τ [s])
log (τ [s])
Fig. 13 a Temperature dependence of the water relaxation times of amorphous and semi-crystalline
3PG—water solution (c w = 50 wt%). In orange symbols, the relaxation times of ice only observed
in the crystalline material. b Comparison of the relaxation times of bulk ice (Ih) [49], ice in solutions
of Bovine Serum Albumin (BSA) [50], collagen [51] and elastin [52], and ice in 3PG solutions after
crystallization Adapted with permission
185
140
150
160
170
180
190
200
210
0
10
20
30
40
50
150
160
170
180
190
200
210
0.0
0.2
0.4
0.6
0.8
1.0
(a)
3PG, c w = 50 wt%
Δε
T [K]
(b)
water relaxation
Semi-crystalline sample
Amorphous sample
α
T [K]
ice relaxation
water relaxation
Fig. 12 a Relaxation strength and b shape factor of amorphous and semi-crystalline 3PG—water
solution (c w = 50 wt%). The glass transition temperatures of the amorphous and semi-crystalline
materials are the same
50 wt%). As expected, the relaxation strength of water decreases whereas the αparameter is only slightly lower in the crystallized material. This indicates that the
environment of the water molecules is not significantly affected after crystallization,
in spite of the fact that an increasing amount of water molecules becomes ice. Finally,
Fig. 13 shows the temperature dependence of the water relaxation time as obtained
4
5
6
7
8
-5
-4
-3
-2
-1
0
1
2
4
5
6
7
8
-7
-6
-5
-4
-3
-2
-1
0
(b)
1000/T [K
-1
]
Ice in 3PG solutions
Bulk ice
Ice in bio-solutions
(a)
1000/T [K
-1
]
ice relaxation
water relaxation
Amorphous sample
Semi-crystalline sample
3PG, c w = 50 wt%
water relaxation
log (τ [s])
log (τ [s])
Fig. 13 a Temperature dependence of the water relaxation times of amorphous and semi-crystalline
3PG—water solution (c w = 50 wt%). In orange symbols, the relaxation times of ice only observed
in the crystalline material. b Comparison of the relaxation times of bulk ice (Ih) [49], ice in solutions
of Bovine Serum Albumin (BSA) [50], collagen [51] and elastin [52], and ice in 3PG solutions after
crystallization Adapted with permission