

Control of Crystallization Pathways by Electric Fields
163
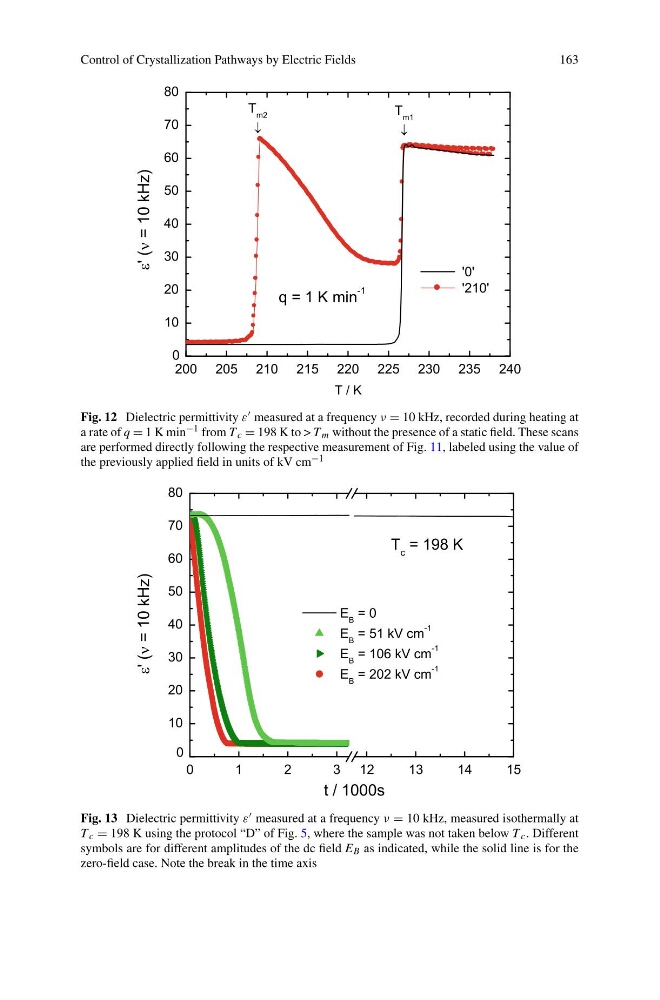
Fig. 12 Dielectric permittivity ε measured at a frequency ν = 10 kHz, recorded during heating at
a rate of q = 1 K min −1 from T c = 198 K to > T m without the presence of a static field. These scans
are performed directly following the respective measurement of Fig. 11, labeled using the value of
the previously applied field in units of kV cm −1
Fig. 13 Dielectric permittivity ε measured at a frequency ν = 10 kHz, measured isothermally at
T c = 198 K using the protocol “D” of Fig. 5, where the sample was not taken below T c . Different
symbols are for different amplitudes of the dc field E B as indicated, while the solid line is for the
zero-field case. Note the break in the time axis
163
Fig. 12 Dielectric permittivity ε measured at a frequency ν = 10 kHz, recorded during heating at
a rate of q = 1 K min −1 from T c = 198 K to > T m without the presence of a static field. These scans
are performed directly following the respective measurement of Fig. 11, labeled using the value of
the previously applied field in units of kV cm −1
Fig. 13 Dielectric permittivity ε measured at a frequency ν = 10 kHz, measured isothermally at
T c = 198 K using the protocol “D” of Fig. 5, where the sample was not taken below T c . Different
symbols are for different amplitudes of the dc field E B as indicated, while the solid line is for the
zero-field case. Note the break in the time axis