

152
K. Adrjanowicz and R. Richert
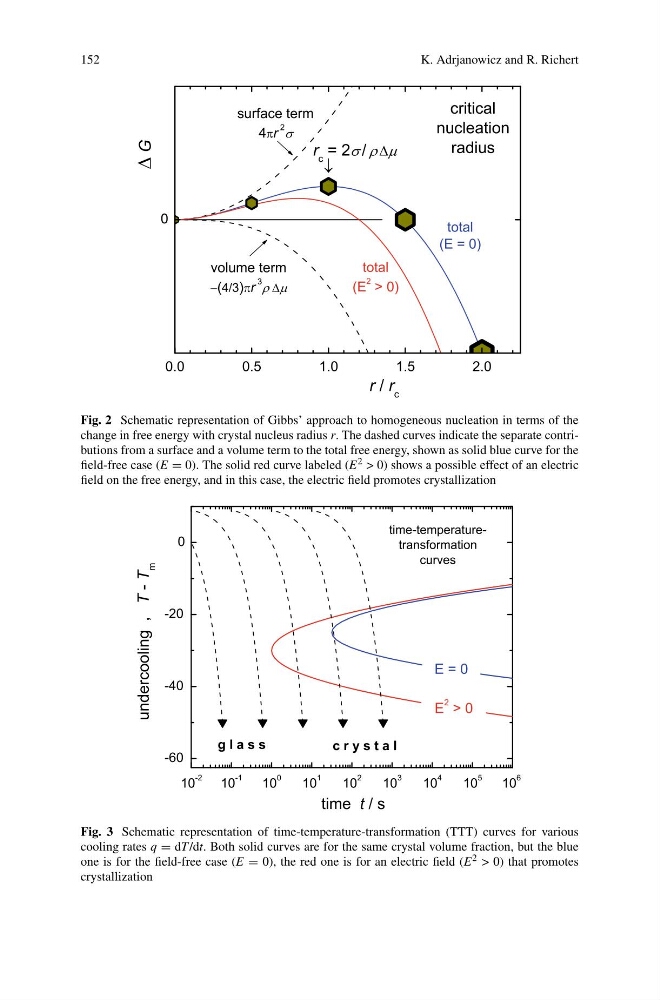
Fig. 2 Schematic representation of Gibbs’ approach to homogeneous nucleation in terms of the
change in free energy with crystal nucleus radius r. The dashed curves indicate the separate contributions from a surface and a volume term to the total free energy, shown as solid blue curve for the
field-free case (E = 0). The solid red curve labeled (E 2 > 0) shows a possible effect of an electric
field on the free energy, and in this case, the electric field promotes crystallization
Fig. 3 Schematic representation of time-temperature-transformation (TTT) curves for various
cooling rates q = dT /dt. Both solid curves are for the same crystal volume fraction, but the blue
one is for the field-free case (E = 0), the red one is for an electric field (E 2 > 0) that promotes
crystallization
K. Adrjanowicz and R. Richert
Fig. 2 Schematic representation of Gibbs’ approach to homogeneous nucleation in terms of the
change in free energy with crystal nucleus radius r. The dashed curves indicate the separate contributions from a surface and a volume term to the total free energy, shown as solid blue curve for the
field-free case (E = 0). The solid red curve labeled (E 2 > 0) shows a possible effect of an electric
field on the free energy, and in this case, the electric field promotes crystallization
Fig. 3 Schematic representation of time-temperature-transformation (TTT) curves for various
cooling rates q = dT /dt. Both solid curves are for the same crystal volume fraction, but the blue
one is for the field-free case (E = 0), the red one is for an electric field (E 2 > 0) that promotes
crystallization