

122
M. Jasiurkowska-Delaporte
2 Experimental Details
The examined liquid crystals (5P-EtFLEt-P5 [20], 5P-Am*FLAm*P5 [22], BBOA
[23], purity > 99.5%) were kindly supplied by Prof. P. Kula, the Military University
of Technology in Warsaw, and used as received.
Thermal analysis was carried out for several cooling/heating rates using a DSC
2500 Differential Scanning Calorimeter (TA Instruments, New Castle, Delaware,
USA). A 6–7 mg sample of the material was placed in an aluminum pan, which was
sealed before measurement. An empty aluminum pan was used as the reference.
The phase transitions of the investigated compounds were also verified: Samples
with a thickness of about 50 μm were placed under a bipolar PI polarizing light
microscope (PZO, Poland) to observe the temperature evolutions of the textures.
The temperature of the sample was controlled with an uncertainty of 0.1 K by means
of a Linkam THM 600 using a flow of liquid nitrogen. The increase of the degree of
crystallinity D(t) over the course of the change in temperature was determined by the
graphical analysis of textures using GIMP (freeware graphics software). Based on
the percentage share of the crystalline fraction in the whole texture layer, the value
of D(t) is estimated as the ratio of the texture area S Cr (t) corresponding to the new
crystalline phase and the total surface area of the texture S:
D(t) =
S Cr (t)
S
(1)
Broadband dielectric measurements were performed using a high-precision
dielectric analyzer (ALPHA analyzer; Novocontrol Technologies, Montabaur,
Germany) in the frequency range of 0.1–10
7 Hz in combination with a Novocool
temperature controller, providing temperature stability greater than 0.1 K. Prior to the
BDS measurements, LC powder was heated up to the isotropic phase; the heating took
place between two circular electrodes 10 mm in diameter which were separated by
Teflon spacers to avoid a short circuit. To describe the detected relaxation processes,
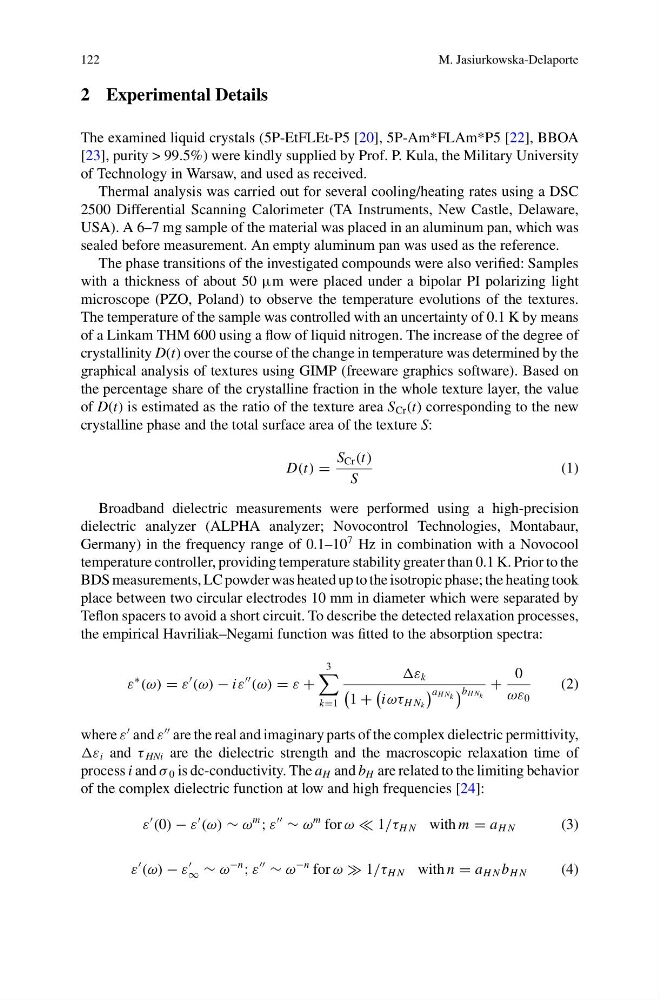
the empirical Havriliak–Negami function was fitted to the absorption spectra:
ε
∗
(ω) = ε
(ω) − iε
(ω) = ε +
3
k=1
ε k
1 +
iωτ H N k
a H N k b H N k
+
0
ωε 0
(2)
where ε
and ε
are the real and imaginary parts of the complex dielectric permittivity,
ε i and τ HNi are the dielectric strength and the macroscopic relaxation time of
process i and σ 0 is dc-conductivity. The a H and b H are related to the limiting behavior
of the complex dielectric function at low and high frequencies [24]:
ε
(0) − ε
(ω) ∼ ω
m
; ε
∼ ω
m for ω 1/τ H N with m = a H N
(3)
ε
(ω) − ε
∞ ∼ ω
−n
; ε
∼ ω
−n for ω 1/τ H N with n = a H N b H N
(4)
M. Jasiurkowska-Delaporte
2 Experimental Details
The examined liquid crystals (5P-EtFLEt-P5 [20], 5P-Am*FLAm*P5 [22], BBOA
[23], purity > 99.5%) were kindly supplied by Prof. P. Kula, the Military University
of Technology in Warsaw, and used as received.
Thermal analysis was carried out for several cooling/heating rates using a DSC
2500 Differential Scanning Calorimeter (TA Instruments, New Castle, Delaware,
USA). A 6–7 mg sample of the material was placed in an aluminum pan, which was
sealed before measurement. An empty aluminum pan was used as the reference.
The phase transitions of the investigated compounds were also verified: Samples
with a thickness of about 50 μm were placed under a bipolar PI polarizing light
microscope (PZO, Poland) to observe the temperature evolutions of the textures.
The temperature of the sample was controlled with an uncertainty of 0.1 K by means
of a Linkam THM 600 using a flow of liquid nitrogen. The increase of the degree of
crystallinity D(t) over the course of the change in temperature was determined by the
graphical analysis of textures using GIMP (freeware graphics software). Based on
the percentage share of the crystalline fraction in the whole texture layer, the value
of D(t) is estimated as the ratio of the texture area S Cr (t) corresponding to the new
crystalline phase and the total surface area of the texture S:
D(t) =
S Cr (t)
S
(1)
Broadband dielectric measurements were performed using a high-precision
dielectric analyzer (ALPHA analyzer; Novocontrol Technologies, Montabaur,
Germany) in the frequency range of 0.1–10
7 Hz in combination with a Novocool
temperature controller, providing temperature stability greater than 0.1 K. Prior to the
BDS measurements, LC powder was heated up to the isotropic phase; the heating took
place between two circular electrodes 10 mm in diameter which were separated by
Teflon spacers to avoid a short circuit. To describe the detected relaxation processes,
the empirical Havriliak–Negami function was fitted to the absorption spectra:
ε
∗
(ω) = ε
(ω) − iε
(ω) = ε +
3
k=1
ε k
1 +
iωτ H N k
a H N k b H N k
+
0
ωε 0
(2)
where ε
and ε
are the real and imaginary parts of the complex dielectric permittivity,
ε i and τ HNi are the dielectric strength and the macroscopic relaxation time of
process i and σ 0 is dc-conductivity. The a H and b H are related to the limiting behavior
of the complex dielectric function at low and high frequencies [24]:
ε
(0) − ε
(ω) ∼ ω
m
; ε
∼ ω
m for ω 1/τ H N with m = a H N
(3)
ε
(ω) − ε
∞ ∼ ω
−n
; ε
∼ ω
−n for ω 1/τ H N with n = a H N b H N
(4)