

Isothermal and Non-isothermal Crystallization in Liquid Crystals …
123
where ε
(0) and ε
∞ describe the value of ε
at the low and high frequency limits,
respectively. The n and (1 − m) parameters [25, 26] indicate the cooperativity of the
reorienting molecules in the local and long-range scales. In some crystalline phases,
the relaxation spectra were obscured by Ohmic conductivity; to eliminate this undesirable contribution, the relaxation spectra were analyzed according to Wübbenhorst
and Turnhout [27, 28] which is based on the approximation
ε
der = −
π∂ε
(ω)
2∂ ln ω
≈ ε
(5)
The derivative of dielectric loss spectra ε
der ( f ) (ω = 2πf , where f is the frequency
of the external electric field) was fitted with the analytical derivative of Havriliak–
Negami function ∂ε
H N /∂ ln ω
∂ε
H N
∂ ln ω
= −
a H N b H N ε(ωτ )
a H N cos
a H N π
2
− (1 + b)θ H N
[1 + 2
ωτ ) a H N cos
πa H N
2
+ (ωτ )
2a H N
1+
b
2
(6)
where
θ H N = arc tan
sin(πa H N /2)/
ωτ )
−a H N + cos(πa H N /2)
(7)
3 Phase Diagrams of Investigated Mesogenic Fluorene
Derivatives with Nematic Phases
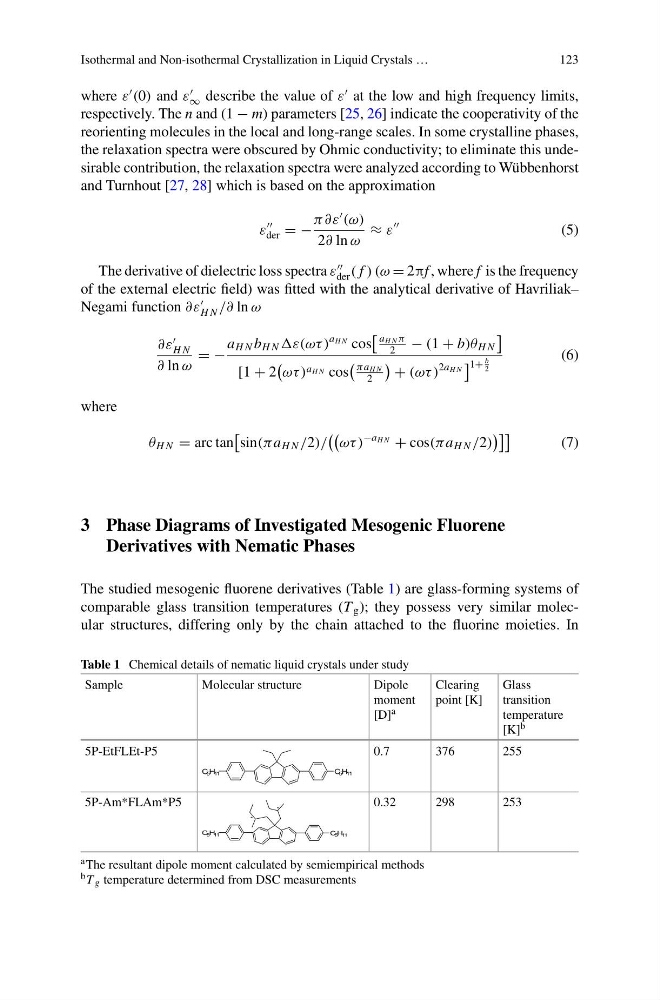
The studied mesogenic fluorene derivatives (Table 1) are glass-forming systems of
comparable glass transition temperatures (T g ); they possess very similar molecular structures, differing only by the chain attached to the fluorine moieties. In
Table 1 Chemical details of nematic liquid crystals under study
Sample
Molecular structure
Dipole
moment
[D] a
Clearing
point [K]
Glass
transition
temperature
[K] b
5P-EtFLEt-P5
C5H11
C5H11
0.7
376
255
5P-Am*FLAm*P5
*
*
C5H11
C5H11
0.32
298
253
a The resultant dipole moment calculated by semiempirical methods
b T g temperature determined from DSC measurements
123
where ε
(0) and ε
∞ describe the value of ε
at the low and high frequency limits,
respectively. The n and (1 − m) parameters [25, 26] indicate the cooperativity of the
reorienting molecules in the local and long-range scales. In some crystalline phases,
the relaxation spectra were obscured by Ohmic conductivity; to eliminate this undesirable contribution, the relaxation spectra were analyzed according to Wübbenhorst
and Turnhout [27, 28] which is based on the approximation
ε
der = −
π∂ε
(ω)
2∂ ln ω
≈ ε
(5)
The derivative of dielectric loss spectra ε
der ( f ) (ω = 2πf , where f is the frequency
of the external electric field) was fitted with the analytical derivative of Havriliak–
Negami function ∂ε
H N /∂ ln ω
∂ε
H N
∂ ln ω
= −
a H N b H N ε(ωτ )
a H N cos
a H N π
2
− (1 + b)θ H N
[1 + 2
ωτ ) a H N cos
πa H N
2
+ (ωτ )
2a H N
1+
b
2
(6)
where
θ H N = arc tan
sin(πa H N /2)/
ωτ )
−a H N + cos(πa H N /2)
(7)
3 Phase Diagrams of Investigated Mesogenic Fluorene
Derivatives with Nematic Phases
The studied mesogenic fluorene derivatives (Table 1) are glass-forming systems of
comparable glass transition temperatures (T g ); they possess very similar molecular structures, differing only by the chain attached to the fluorine moieties. In
Table 1 Chemical details of nematic liquid crystals under study
Sample
Molecular structure
Dipole
moment
[D] a
Clearing
point [K]
Glass
transition
temperature
[K] b
5P-EtFLEt-P5
C5H11
C5H11
0.7
376
255
5P-Am*FLAm*P5
*
*
C5H11
C5H11
0.32
298
253
a The resultant dipole moment calculated by semiempirical methods
b T g temperature determined from DSC measurements