

Ordering Transitions in Short-Chain Alcohols
113
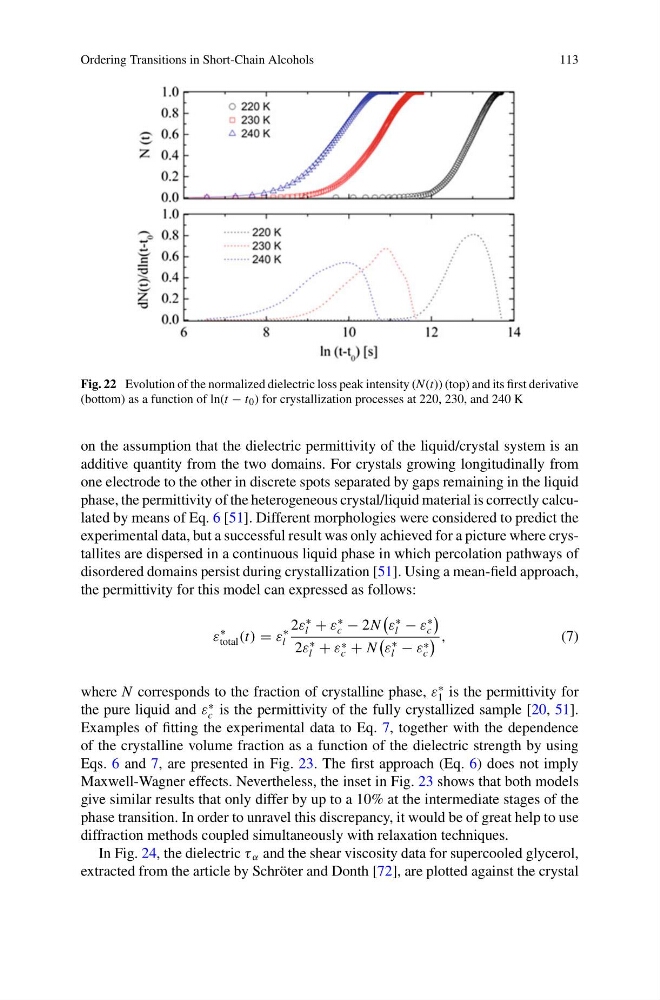
Fig. 22 Evolution of the normalized dielectric loss peak intensity (N(t)) (top) and its first derivative
(bottom) as a function of ln(t − t 0 ) for crystallization processes at 220, 230, and 240 K
on the assumption that the dielectric permittivity of the liquid/crystal system is an
additive quantity from the two domains. For crystals growing longitudinally from
one electrode to the other in discrete spots separated by gaps remaining in the liquid
phase, the permittivity of the heterogeneous crystal/liquid material is correctly calculated by means of Eq. 6 [51]. Different morphologies were considered to predict the
experimental data, but a successful result was only achieved for a picture where crystallites are dispersed in a continuous liquid phase in which percolation pathways of
disordered domains persist during crystallization [51]. Using a mean-field approach,
the permittivity for this model can expressed as follows:
ε
∗
total (t) = ε
∗
l
2ε
∗
l + ε
∗
c − 2N
ε
∗
l − ε
∗
c
2ε
∗
l + ε ∗
c + N
ε
∗
l − ε ∗
c
,
(7)
where N corresponds to the fraction of crystalline phase, ε
∗
1 is the permittivity for
the pure liquid and ε
∗
c is the permittivity of the fully crystallized sample [20, 51].
Examples of fitting the experimental data to Eq. 7, together with the dependence
of the crystalline volume fraction as a function of the dielectric strength by using
Eqs. 6 and 7, are presented in Fig. 23. The first approach (Eq. 6) does not imply
Maxwell-Wagner effects. Nevertheless, the inset in Fig. 23 shows that both models
give similar results that only differ by up to a 10% at the intermediate stages of the
phase transition. In order to unravel this discrepancy, it would be of great help to use
diffraction methods coupled simultaneously with relaxation techniques.
In Fig. 24, the dielectric τ α and the shear viscosity data for supercooled glycerol,
extracted from the article by Schröter and Donth [72], are plotted against the crystal
113
Fig. 22 Evolution of the normalized dielectric loss peak intensity (N(t)) (top) and its first derivative
(bottom) as a function of ln(t − t 0 ) for crystallization processes at 220, 230, and 240 K
on the assumption that the dielectric permittivity of the liquid/crystal system is an
additive quantity from the two domains. For crystals growing longitudinally from
one electrode to the other in discrete spots separated by gaps remaining in the liquid
phase, the permittivity of the heterogeneous crystal/liquid material is correctly calculated by means of Eq. 6 [51]. Different morphologies were considered to predict the
experimental data, but a successful result was only achieved for a picture where crystallites are dispersed in a continuous liquid phase in which percolation pathways of
disordered domains persist during crystallization [51]. Using a mean-field approach,
the permittivity for this model can expressed as follows:
ε
∗
total (t) = ε
∗
l
2ε
∗
l + ε
∗
c − 2N
ε
∗
l − ε
∗
c
2ε
∗
l + ε ∗
c + N
ε
∗
l − ε ∗
c
,
(7)
where N corresponds to the fraction of crystalline phase, ε
∗
1 is the permittivity for
the pure liquid and ε
∗
c is the permittivity of the fully crystallized sample [20, 51].
Examples of fitting the experimental data to Eq. 7, together with the dependence
of the crystalline volume fraction as a function of the dielectric strength by using
Eqs. 6 and 7, are presented in Fig. 23. The first approach (Eq. 6) does not imply
Maxwell-Wagner effects. Nevertheless, the inset in Fig. 23 shows that both models
give similar results that only differ by up to a 10% at the intermediate stages of the
phase transition. In order to unravel this discrepancy, it would be of great help to use
diffraction methods coupled simultaneously with relaxation techniques.
In Fig. 24, the dielectric τ α and the shear viscosity data for supercooled glycerol,
extracted from the article by Schröter and Donth [72], are plotted against the crystal