

114
A. Sanz
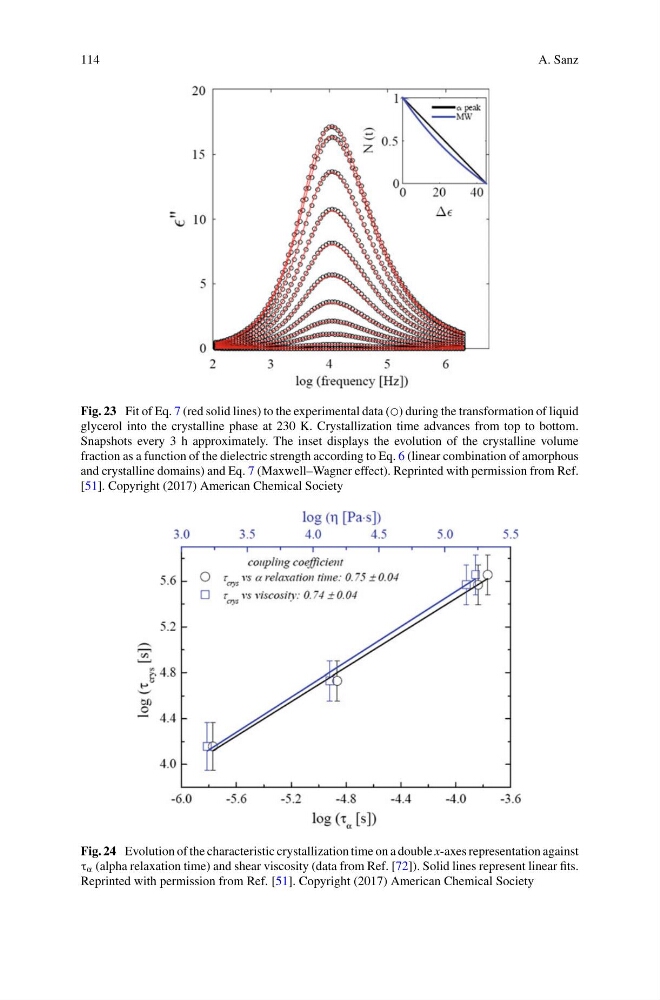
Fig. 23 Fit of Eq. 7 (red solid lines) to the experimental data (◯) during the transformation of liquid
glycerol into the crystalline phase at 230 K. Crystallization time advances from top to bottom.
Snapshots every 3 h approximately. The inset displays the evolution of the crystalline volume
fraction as a function of the dielectric strength according to Eq. 6 (linear combination of amorphous
and crystalline domains) and Eq. 7 (Maxwell–Wagner effect). Reprinted with permission from Ref.
[51]. Copyright (2017) American Chemical Society
Fig. 24 Evolution of the characteristic crystallization time on a double x-axes representation against
τ α (alpha relaxation time) and shear viscosity (data from Ref. [72]). Solid lines represent linear fits.
Reprinted with permission from Ref. [51]. Copyright (2017) American Chemical Society
A. Sanz
Fig. 23 Fit of Eq. 7 (red solid lines) to the experimental data (◯) during the transformation of liquid
glycerol into the crystalline phase at 230 K. Crystallization time advances from top to bottom.
Snapshots every 3 h approximately. The inset displays the evolution of the crystalline volume
fraction as a function of the dielectric strength according to Eq. 6 (linear combination of amorphous
and crystalline domains) and Eq. 7 (Maxwell–Wagner effect). Reprinted with permission from Ref.
[51]. Copyright (2017) American Chemical Society
Fig. 24 Evolution of the characteristic crystallization time on a double x-axes representation against
τ α (alpha relaxation time) and shear viscosity (data from Ref. [72]). Solid lines represent linear fits.
Reprinted with permission from Ref. [51]. Copyright (2017) American Chemical Society