

112
A. Sanz
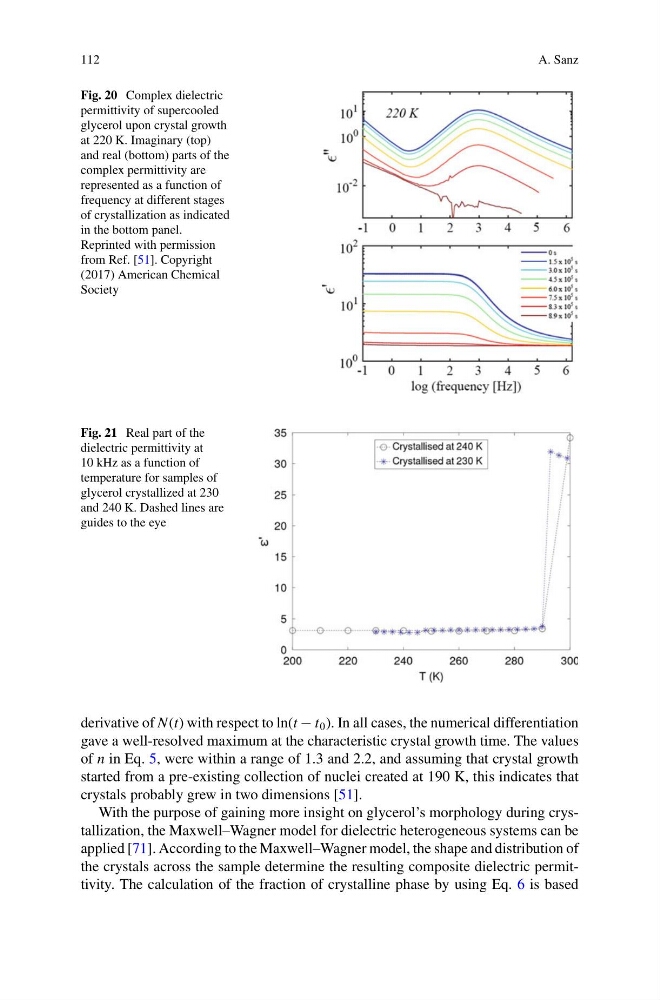
Fig. 20 Complex dielectric
permittivity of supercooled
glycerol upon crystal growth
at 220 K. Imaginary (top)
and real (bottom) parts of the
complex permittivity are
represented as a function of
frequency at different stages
of crystallization as indicated
in the bottom panel.
Reprinted with permission
from Ref. [51]. Copyright
(2017) American Chemical
Society
Fig. 21 Real part of the
dielectric permittivity at
10 kHz as a function of
temperature for samples of
glycerol crystallized at 230
and 240 K. Dashed lines are
guides to the eye
derivative of N(t) with respect to ln(t − t 0 ). In all cases, the numerical differentiation
gave a well-resolved maximum at the characteristic crystal growth time. The values
of n in Eq. 5, were within a range of 1.3 and 2.2, and assuming that crystal growth
started from a pre-existing collection of nuclei created at 190 K, this indicates that
crystals probably grew in two dimensions [51].
With the purpose of gaining more insight on glycerol’s morphology during crystallization, the Maxwell–Wagner model for dielectric heterogeneous systems can be
applied [71]. According to the Maxwell–Wagner model, the shape and distribution of
the crystals across the sample determine the resulting composite dielectric permittivity. The calculation of the fraction of crystalline phase by using Eq. 6 is based
A. Sanz
Fig. 20 Complex dielectric
permittivity of supercooled
glycerol upon crystal growth
at 220 K. Imaginary (top)
and real (bottom) parts of the
complex permittivity are
represented as a function of
frequency at different stages
of crystallization as indicated
in the bottom panel.
Reprinted with permission
from Ref. [51]. Copyright
(2017) American Chemical
Society
Fig. 21 Real part of the
dielectric permittivity at
10 kHz as a function of
temperature for samples of
glycerol crystallized at 230
and 240 K. Dashed lines are
guides to the eye
derivative of N(t) with respect to ln(t − t 0 ). In all cases, the numerical differentiation
gave a well-resolved maximum at the characteristic crystal growth time. The values
of n in Eq. 5, were within a range of 1.3 and 2.2, and assuming that crystal growth
started from a pre-existing collection of nuclei created at 190 K, this indicates that
crystals probably grew in two dimensions [51].
With the purpose of gaining more insight on glycerol’s morphology during crystallization, the Maxwell–Wagner model for dielectric heterogeneous systems can be
applied [71]. According to the Maxwell–Wagner model, the shape and distribution of
the crystals across the sample determine the resulting composite dielectric permittivity. The calculation of the fraction of crystalline phase by using Eq. 6 is based