

Ordering Transitions in Short-Chain Alcohols
109
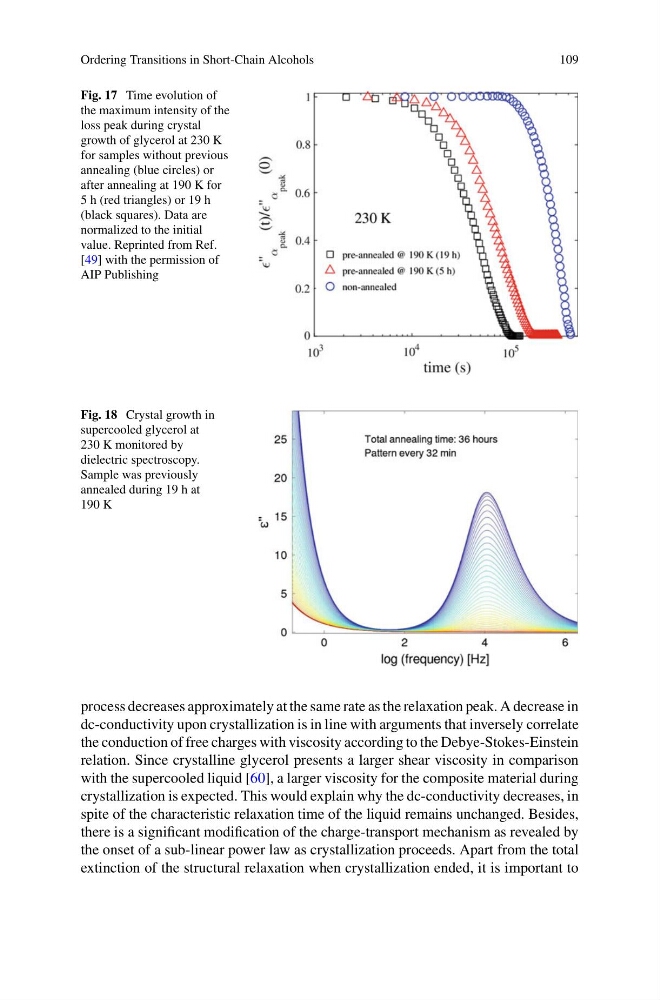
Fig. 17 Time evolution of
the maximum intensity of the
loss peak during crystal
growth of glycerol at 230 K
for samples without previous
annealing (blue circles) or
after annealing at 190 K for
5 h (red triangles) or 19 h
(black squares). Data are
normalized to the initial
value. Reprinted from Ref.
[49] with the permission of
AIP Publishing
Fig. 18 Crystal growth in
supercooled glycerol at
230 K monitored by
dielectric spectroscopy.
Sample was previously
annealed during 19 h at
190 K
process decreases approximately at the same rate as the relaxation peak. A decrease in
dc-conductivity upon crystallization is in line with arguments that inversely correlate
the conduction of free charges with viscosity according to the Debye-Stokes-Einstein
relation. Since crystalline glycerol presents a larger shear viscosity in comparison
with the supercooled liquid [60], a larger viscosity for the composite material during
crystallization is expected. This would explain why the dc-conductivity decreases, in
spite of the characteristic relaxation time of the liquid remains unchanged. Besides,
there is a significant modification of the charge-transport mechanism as revealed by
the onset of a sub-linear power law as crystallization proceeds. Apart from the total
extinction of the structural relaxation when crystallization ended, it is important to
109
Fig. 17 Time evolution of
the maximum intensity of the
loss peak during crystal
growth of glycerol at 230 K
for samples without previous
annealing (blue circles) or
after annealing at 190 K for
5 h (red triangles) or 19 h
(black squares). Data are
normalized to the initial
value. Reprinted from Ref.
[49] with the permission of
AIP Publishing
Fig. 18 Crystal growth in
supercooled glycerol at
230 K monitored by
dielectric spectroscopy.
Sample was previously
annealed during 19 h at
190 K
process decreases approximately at the same rate as the relaxation peak. A decrease in
dc-conductivity upon crystallization is in line with arguments that inversely correlate
the conduction of free charges with viscosity according to the Debye-Stokes-Einstein
relation. Since crystalline glycerol presents a larger shear viscosity in comparison
with the supercooled liquid [60], a larger viscosity for the composite material during
crystallization is expected. This would explain why the dc-conductivity decreases, in
spite of the characteristic relaxation time of the liquid remains unchanged. Besides,
there is a significant modification of the charge-transport mechanism as revealed by
the onset of a sub-linear power law as crystallization proceeds. Apart from the total
extinction of the structural relaxation when crystallization ended, it is important to