

104
A. Sanz
motions related to the main dielectric relaxation is observed, as well as evidences of
the necessity of a deep reorganization of the HB network as a precursor step of the
overall crystallization process, similar to what is found for the ordinary crystallization
of isopropanol from the supercooled liquid state. As an example, two dielectric
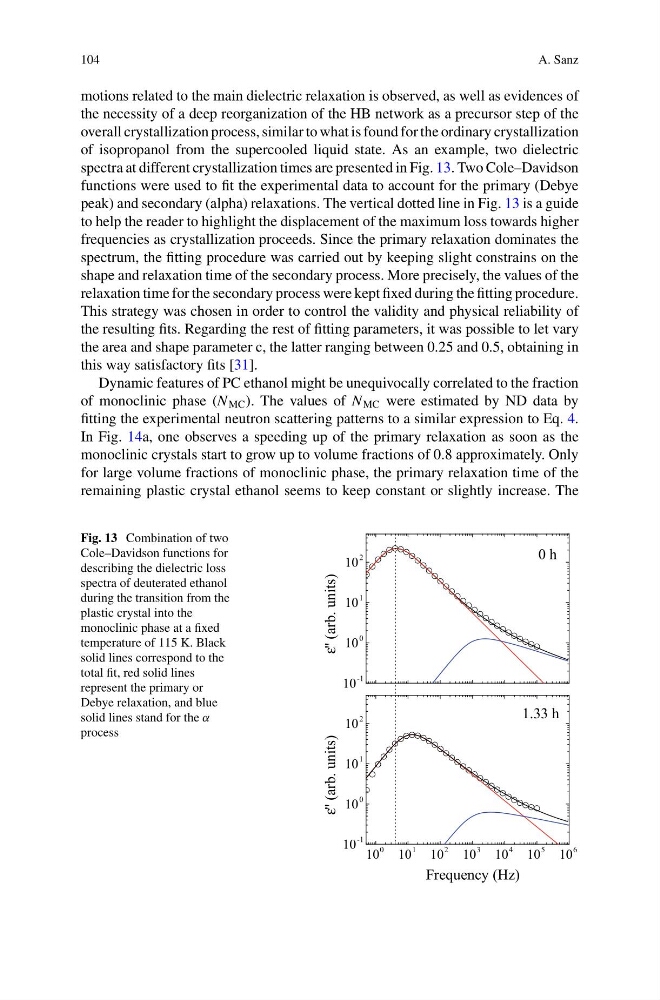
spectra at different crystallization times are presented in Fig. 13. Two Cole–Davidson
functions were used to fit the experimental data to account for the primary (Debye
peak) and secondary (alpha) relaxations. The vertical dotted line in Fig. 13 is a guide
to help the reader to highlight the displacement of the maximum loss towards higher
frequencies as crystallization proceeds. Since the primary relaxation dominates the
spectrum, the fitting procedure was carried out by keeping slight constrains on the
shape and relaxation time of the secondary process. More precisely, the values of the
relaxation time for the secondary process were kept fixed during the fitting procedure.
This strategy was chosen in order to control the validity and physical reliability of
the resulting fits. Regarding the rest of fitting parameters, it was possible to let vary
the area and shape parameter c, the latter ranging between 0.25 and 0.5, obtaining in
this way satisfactory fits [31].
Dynamic features of PC ethanol might be unequivocally correlated to the fraction
of monoclinic phase (N MC ). The values of N MC were estimated by ND data by
fitting the experimental neutron scattering patterns to a similar expression to Eq. 4.
In Fig. 14a, one observes a speeding up of the primary relaxation as soon as the
monoclinic crystals start to grow up to volume fractions of 0.8 approximately. Only
for large volume fractions of monoclinic phase, the primary relaxation time of the
remaining plastic crystal ethanol seems to keep constant or slightly increase. The
Fig. 13 Combination of two
Cole–Davidson functions for
describing the dielectric loss
spectra of deuterated ethanol
during the transition from the
plastic crystal into the
monoclinic phase at a fixed
temperature of 115 K. Black
solid lines correspond to the
total fit, red solid lines
represent the primary or
Debye relaxation, and blue
solid lines stand for the α
process
10
-1
10
0
10
1
10
2
ε'' (arb. units)
0 h
10
0
10
1
10
2
10
3
10
4
10
5
10
6
10
-1
10
0
10
1
10
2
ε'' (arb. units)
Frequency (Hz)
1.33 h
A. Sanz
motions related to the main dielectric relaxation is observed, as well as evidences of
the necessity of a deep reorganization of the HB network as a precursor step of the
overall crystallization process, similar to what is found for the ordinary crystallization
of isopropanol from the supercooled liquid state. As an example, two dielectric
spectra at different crystallization times are presented in Fig. 13. Two Cole–Davidson
functions were used to fit the experimental data to account for the primary (Debye
peak) and secondary (alpha) relaxations. The vertical dotted line in Fig. 13 is a guide
to help the reader to highlight the displacement of the maximum loss towards higher
frequencies as crystallization proceeds. Since the primary relaxation dominates the
spectrum, the fitting procedure was carried out by keeping slight constrains on the
shape and relaxation time of the secondary process. More precisely, the values of the
relaxation time for the secondary process were kept fixed during the fitting procedure.
This strategy was chosen in order to control the validity and physical reliability of
the resulting fits. Regarding the rest of fitting parameters, it was possible to let vary
the area and shape parameter c, the latter ranging between 0.25 and 0.5, obtaining in
this way satisfactory fits [31].
Dynamic features of PC ethanol might be unequivocally correlated to the fraction
of monoclinic phase (N MC ). The values of N MC were estimated by ND data by
fitting the experimental neutron scattering patterns to a similar expression to Eq. 4.
In Fig. 14a, one observes a speeding up of the primary relaxation as soon as the
monoclinic crystals start to grow up to volume fractions of 0.8 approximately. Only
for large volume fractions of monoclinic phase, the primary relaxation time of the
remaining plastic crystal ethanol seems to keep constant or slightly increase. The
Fig. 13 Combination of two
Cole–Davidson functions for
describing the dielectric loss
spectra of deuterated ethanol
during the transition from the
plastic crystal into the
monoclinic phase at a fixed
temperature of 115 K. Black
solid lines correspond to the
total fit, red solid lines
represent the primary or
Debye relaxation, and blue
solid lines stand for the α
process
10
-1
10
0
10
1
10
2
ε'' (arb. units)
0 h
10
0
10
1
10
2
10
3
10
4
10
5
10
6
10
-1
10
0
10
1
10
2
ε'' (arb. units)
Frequency (Hz)
1.33 h