

Ordering Transitions in Short-Chain Alcohols
105
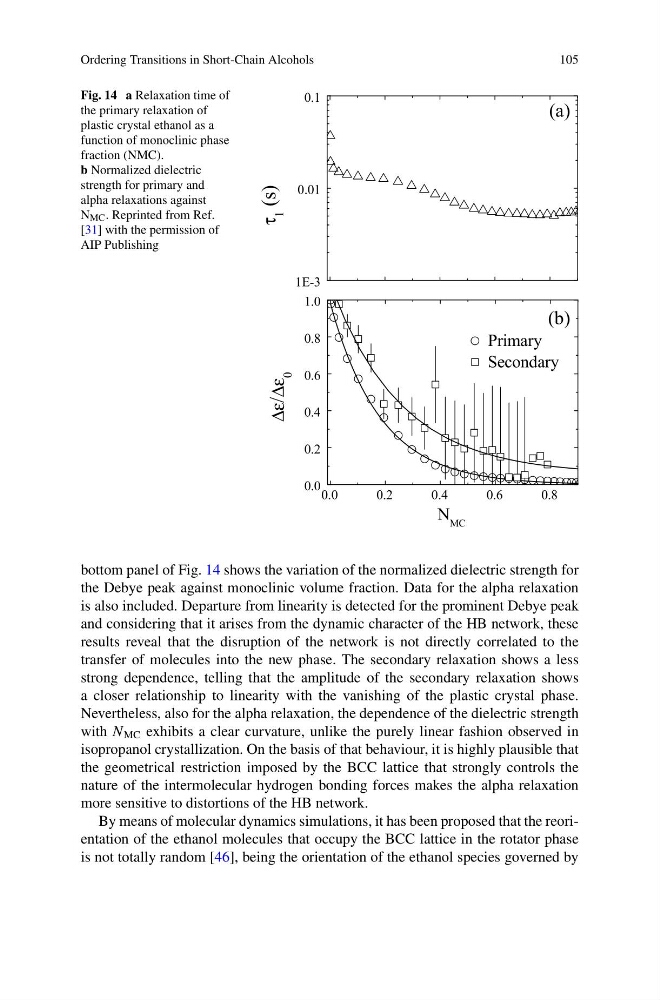
Fig. 14 a Relaxation time of
the primary relaxation of
plastic crystal ethanol as a
function of monoclinic phase
fraction (NMC).
b Normalized dielectric
strength for primary and
alpha relaxations against
N MC . Reprinted from Ref.
[31] with the permission of
AIP Publishing
0.0
0.2
0.4
0.6
0.8
0.0
0.2
0.4
0.6
0.8
1.0
Primary
Secondary
Δε/Δε
0
N MC
(b)
1E-3
0.01
0.1
τ
1
(s)
(a)
bottom panel of Fig. 14 shows the variation of the normalized dielectric strength for
the Debye peak against monoclinic volume fraction. Data for the alpha relaxation
is also included. Departure from linearity is detected for the prominent Debye peak
and considering that it arises from the dynamic character of the HB network, these
results reveal that the disruption of the network is not directly correlated to the
transfer of molecules into the new phase. The secondary relaxation shows a less
strong dependence, telling that the amplitude of the secondary relaxation shows
a closer relationship to linearity with the vanishing of the plastic crystal phase.
Nevertheless, also for the alpha relaxation, the dependence of the dielectric strength
with N MC exhibits a clear curvature, unlike the purely linear fashion observed in
isopropanol crystallization. On the basis of that behaviour, it is highly plausible that
the geometrical restriction imposed by the BCC lattice that strongly controls the
nature of the intermolecular hydrogen bonding forces makes the alpha relaxation
more sensitive to distortions of the HB network.
By means of molecular dynamics simulations, it has been proposed that the reorientation of the ethanol molecules that occupy the BCC lattice in the rotator phase
is not totally random [46], being the orientation of the ethanol species governed by
105
Fig. 14 a Relaxation time of
the primary relaxation of
plastic crystal ethanol as a
function of monoclinic phase
fraction (NMC).
b Normalized dielectric
strength for primary and
alpha relaxations against
N MC . Reprinted from Ref.
[31] with the permission of
AIP Publishing
0.0
0.2
0.4
0.6
0.8
0.0
0.2
0.4
0.6
0.8
1.0
Primary
Secondary
Δε/Δε
0
N MC
(b)
1E-3
0.01
0.1
τ
1
(s)
(a)
bottom panel of Fig. 14 shows the variation of the normalized dielectric strength for
the Debye peak against monoclinic volume fraction. Data for the alpha relaxation
is also included. Departure from linearity is detected for the prominent Debye peak
and considering that it arises from the dynamic character of the HB network, these
results reveal that the disruption of the network is not directly correlated to the
transfer of molecules into the new phase. The secondary relaxation shows a less
strong dependence, telling that the amplitude of the secondary relaxation shows
a closer relationship to linearity with the vanishing of the plastic crystal phase.
Nevertheless, also for the alpha relaxation, the dependence of the dielectric strength
with N MC exhibits a clear curvature, unlike the purely linear fashion observed in
isopropanol crystallization. On the basis of that behaviour, it is highly plausible that
the geometrical restriction imposed by the BCC lattice that strongly controls the
nature of the intermolecular hydrogen bonding forces makes the alpha relaxation
more sensitive to distortions of the HB network.
By means of molecular dynamics simulations, it has been proposed that the reorientation of the ethanol molecules that occupy the BCC lattice in the rotator phase
is not totally random [46], being the orientation of the ethanol species governed by