

102
A. Sanz
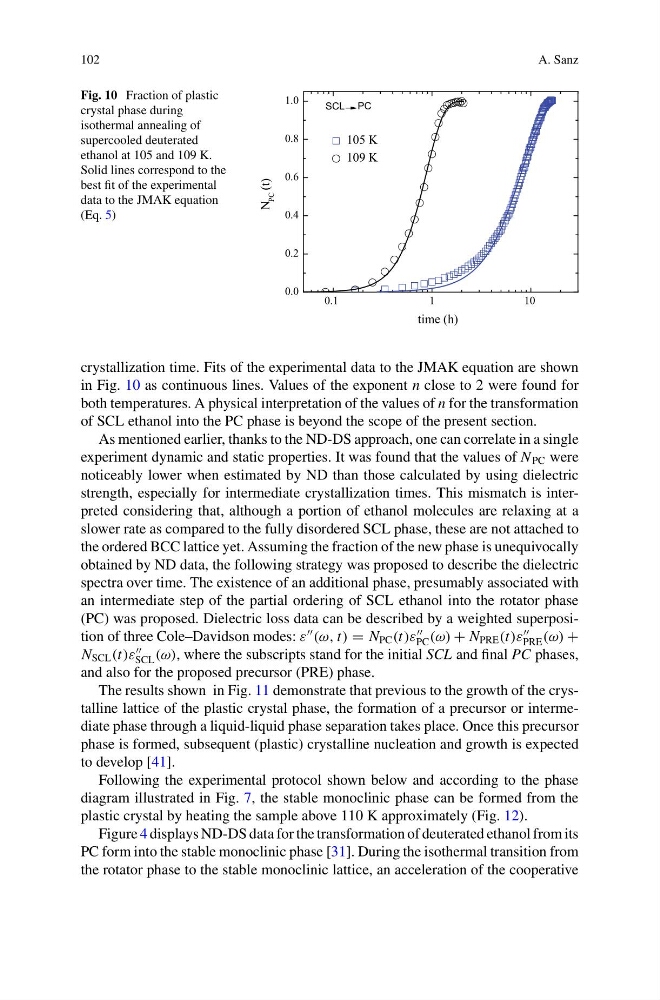
Fig. 10 Fraction of plastic
crystal phase during
isothermal annealing of
supercooled deuterated
ethanol at 105 and 109 K.
Solid lines correspond to the
best fit of the experimental
data to the JMAK equation
(Eq. 5)
0.1
1
10
0.0
0.2
0.4
0.6
0.8
1.0
105 K
109 K
N
PC
(t)
time (h)
crystallization time. Fits of the experimental data to the JMAK equation are shown
in Fig. 10 as continuous lines. Values of the exponent n close to 2 were found for
both temperatures. A physical interpretation of the values of n for the transformation
of SCL ethanol into the PC phase is beyond the scope of the present section.
As mentioned earlier, thanks to the ND-DS approach, one can correlate in a single
experiment dynamic and static properties. It was found that the values of N PC were
noticeably lower when estimated by ND than those calculated by using dielectric
strength, especially for intermediate crystallization times. This mismatch is interpreted considering that, although a portion of ethanol molecules are relaxing at a
slower rate as compared to the fully disordered SCL phase, these are not attached to
the ordered BCC lattice yet. Assuming the fraction of the new phase is unequivocally
obtained by ND data, the following strategy was proposed to describe the dielectric
spectra over time. The existence of an additional phase, presumably associated with
an intermediate step of the partial ordering of SCL ethanol into the rotator phase
(PC) was proposed. Dielectric loss data can be described by a weighted superposition of three Cole–Davidson modes: ε
(ω, t) = N PC (t)ε
PC (ω) + N PRE (t)ε
PRE (ω) +
N SCL (t)ε
SCL (ω), where the subscripts stand for the initial SCL and final PC phases,
and also for the proposed precursor (PRE) phase.
The results shown in Fig. 11 demonstrate that previous to the growth of the crystalline lattice of the plastic crystal phase, the formation of a precursor or intermediate phase through a liquid-liquid phase separation takes place. Once this precursor
phase is formed, subsequent (plastic) crystalline nucleation and growth is expected
to develop [41].
Following the experimental protocol shown below and according to the phase
diagram illustrated in Fig. 7, the stable monoclinic phase can be formed from the
plastic crystal by heating the sample above 110 K approximately (Fig. 12).
Figure 4 displays ND-DS data for the transformation of deuterated ethanol from its
PC form into the stable monoclinic phase [31]. During the isothermal transition from
the rotator phase to the stable monoclinic lattice, an acceleration of the cooperative
A. Sanz
Fig. 10 Fraction of plastic
crystal phase during
isothermal annealing of
supercooled deuterated
ethanol at 105 and 109 K.
Solid lines correspond to the
best fit of the experimental
data to the JMAK equation
(Eq. 5)
0.1
1
10
0.0
0.2
0.4
0.6
0.8
1.0
105 K
109 K
N
PC
(t)
time (h)
crystallization time. Fits of the experimental data to the JMAK equation are shown
in Fig. 10 as continuous lines. Values of the exponent n close to 2 were found for
both temperatures. A physical interpretation of the values of n for the transformation
of SCL ethanol into the PC phase is beyond the scope of the present section.
As mentioned earlier, thanks to the ND-DS approach, one can correlate in a single
experiment dynamic and static properties. It was found that the values of N PC were
noticeably lower when estimated by ND than those calculated by using dielectric
strength, especially for intermediate crystallization times. This mismatch is interpreted considering that, although a portion of ethanol molecules are relaxing at a
slower rate as compared to the fully disordered SCL phase, these are not attached to
the ordered BCC lattice yet. Assuming the fraction of the new phase is unequivocally
obtained by ND data, the following strategy was proposed to describe the dielectric
spectra over time. The existence of an additional phase, presumably associated with
an intermediate step of the partial ordering of SCL ethanol into the rotator phase
(PC) was proposed. Dielectric loss data can be described by a weighted superposition of three Cole–Davidson modes: ε
(ω, t) = N PC (t)ε
PC (ω) + N PRE (t)ε
PRE (ω) +
N SCL (t)ε
SCL (ω), where the subscripts stand for the initial SCL and final PC phases,
and also for the proposed precursor (PRE) phase.
The results shown in Fig. 11 demonstrate that previous to the growth of the crystalline lattice of the plastic crystal phase, the formation of a precursor or intermediate phase through a liquid-liquid phase separation takes place. Once this precursor
phase is formed, subsequent (plastic) crystalline nucleation and growth is expected
to develop [41].
Following the experimental protocol shown below and according to the phase
diagram illustrated in Fig. 7, the stable monoclinic phase can be formed from the
plastic crystal by heating the sample above 110 K approximately (Fig. 12).
Figure 4 displays ND-DS data for the transformation of deuterated ethanol from its
PC form into the stable monoclinic phase [31]. During the isothermal transition from
the rotator phase to the stable monoclinic lattice, an acceleration of the cooperative