

Ordering Transitions in Short-Chain Alcohols
101
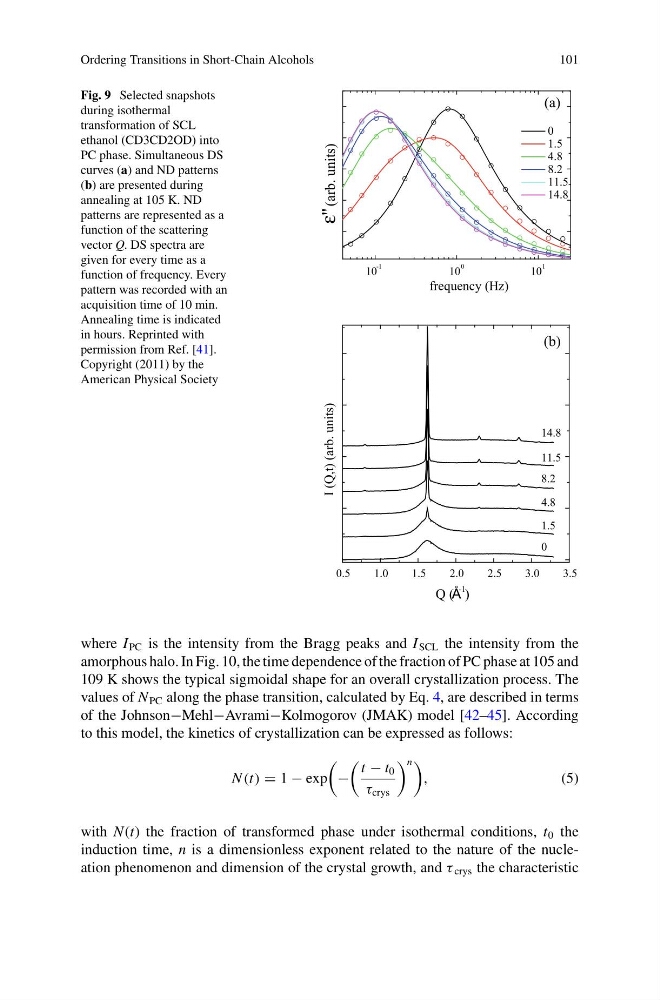
Fig. 9 Selected snapshots
during isothermal
transformation of SCL
ethanol (CD3CD2OD) into
PC phase. Simultaneous DS
curves (a) and ND patterns
(b) are presented during
annealing at 105 K. ND
patterns are represented as a
function of the scattering
vector Q. DS spectra are
given for every time as a
function of frequency. Every
pattern was recorded with an
acquisition time of 10 min.
Annealing time is indicated
in hours. Reprinted with
permission from Ref. [41].
Copyright (2011) by the
American Physical Society
10
-1
10
0
10
1
0
1.5
4.8
8.2
11.5
14.8
(arb. units)
frequency (Hz)
(a)
0.5
1.0
1.5
2.0
2.5
3.0
3.5
(b)
14.8
11.5
8.2
4.8
1.5
I (Q,t) (arb. units)
Q (Å
-1
)
0
where I PC is the intensity from the Bragg peaks and I SCL the intensity from the
amorphous halo. In Fig. 10, the time dependence of the fraction of PC phase at 105 and
109 K shows the typical sigmoidal shape for an overall crystallization process. The
values of N PC along the phase transition, calculated by Eq. 4, are described in terms
of the Johnson−Mehl−Avrami−Kolmogorov (JMAK) model [42–45]. According
to this model, the kinetics of crystallization can be expressed as follows:
N (t) = 1 − exp
−
t − t 0
τ crys
n
,
(5)
with N(t) the fraction of transformed phase under isothermal conditions, t 0 the
induction time, n is a dimensionless exponent related to the nature of the nucleation phenomenon and dimension of the crystal growth, and τ crys the characteristic
101
Fig. 9 Selected snapshots
during isothermal
transformation of SCL
ethanol (CD3CD2OD) into
PC phase. Simultaneous DS
curves (a) and ND patterns
(b) are presented during
annealing at 105 K. ND
patterns are represented as a
function of the scattering
vector Q. DS spectra are
given for every time as a
function of frequency. Every
pattern was recorded with an
acquisition time of 10 min.
Annealing time is indicated
in hours. Reprinted with
permission from Ref. [41].
Copyright (2011) by the
American Physical Society
10
-1
10
0
10
1
0
1.5
4.8
8.2
11.5
14.8
(arb. units)
frequency (Hz)
(a)
0.5
1.0
1.5
2.0
2.5
3.0
3.5
(b)
14.8
11.5
8.2
4.8
1.5
I (Q,t) (arb. units)
Q (Å
-1
)
0
where I PC is the intensity from the Bragg peaks and I SCL the intensity from the
amorphous halo. In Fig. 10, the time dependence of the fraction of PC phase at 105 and
109 K shows the typical sigmoidal shape for an overall crystallization process. The
values of N PC along the phase transition, calculated by Eq. 4, are described in terms
of the Johnson−Mehl−Avrami−Kolmogorov (JMAK) model [42–45]. According
to this model, the kinetics of crystallization can be expressed as follows:
N (t) = 1 − exp
−
t − t 0
τ crys
n
,
(5)
with N(t) the fraction of transformed phase under isothermal conditions, t 0 the
induction time, n is a dimensionless exponent related to the nature of the nucleation phenomenon and dimension of the crystal growth, and τ crys the characteristic