

5.8 Development of Diagnostic Speckle-Optical Criteria for …
431
3. Correlation of the average spectrum frequency to asymmetry
Q =
f
A s
(5.29)
The study of microhemodynamics of skin in different functional states was
conducted using the developed sample of the laser specklometer.
5.9 Investigation of Microhemodynamics of Human Skin
Using the Speckle-Optical Method and Obtaining
Microhemodynamic Maps
The study of microhemodynamics of skin in different functional states was conducted
with the laser specklometer. The scheme of testing is presented in Fig. 5.38.
The studied skin area on the back of the hand was illuminated with the laser
irradiation. The blood flow intensity was changed with an inflatable cuff, which
was preliminary put on the forearm. The spectrum was calculated in the range of
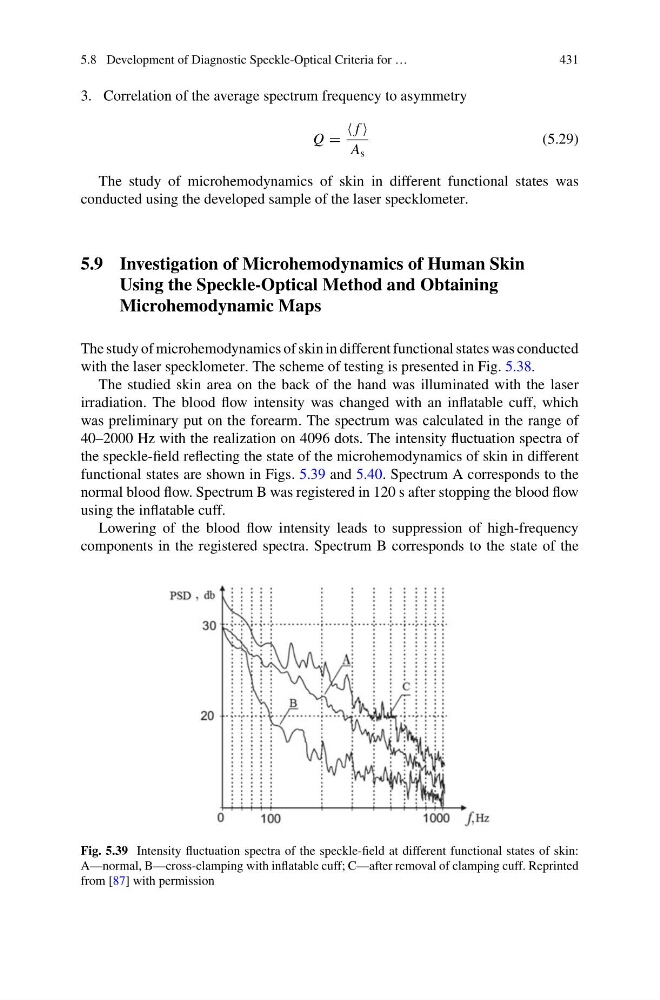
40–2000 Hz with the realization on 4096 dots. The intensity fluctuation spectra of
the speckle-field reflecting the state of the microhemodynamics of skin in different
functional states are shown in Figs. 5.39 and 5.40. Spectrum A corresponds to the
normal blood flow. Spectrum B was registered in 120 s after stopping the blood flow
using the inflatable cuff.
Lowering of the blood flow intensity leads to suppression of high-frequency
components in the registered spectra. Spectrum B corresponds to the state of the
Fig. 5.39 Intensity fluctuation spectra of the speckle-field at different functional states of skin:
A—normal, B—cross-clamping with inflatable cuff; C—after removal of clamping cuff. Reprinted
from [87] with permission
431
3. Correlation of the average spectrum frequency to asymmetry
Q =
f
A s
(5.29)
The study of microhemodynamics of skin in different functional states was
conducted using the developed sample of the laser specklometer.
5.9 Investigation of Microhemodynamics of Human Skin
Using the Speckle-Optical Method and Obtaining
Microhemodynamic Maps
The study of microhemodynamics of skin in different functional states was conducted
with the laser specklometer. The scheme of testing is presented in Fig. 5.38.
The studied skin area on the back of the hand was illuminated with the laser
irradiation. The blood flow intensity was changed with an inflatable cuff, which
was preliminary put on the forearm. The spectrum was calculated in the range of
40–2000 Hz with the realization on 4096 dots. The intensity fluctuation spectra of
the speckle-field reflecting the state of the microhemodynamics of skin in different
functional states are shown in Figs. 5.39 and 5.40. Spectrum A corresponds to the
normal blood flow. Spectrum B was registered in 120 s after stopping the blood flow
using the inflatable cuff.
Lowering of the blood flow intensity leads to suppression of high-frequency
components in the registered spectra. Spectrum B corresponds to the state of the
Fig. 5.39 Intensity fluctuation spectra of the speckle-field at different functional states of skin:
A—normal, B—cross-clamping with inflatable cuff; C—after removal of clamping cuff. Reprinted
from [87] with permission