

430
5 Laser Specklometer, Speckle-Optical Diagnostics and Laser …
of the spectrum, frequency dispersion and moments of higher orders, average fluctuation power, ratio of spectral harmonics from different frequency ranges, correlation time, median, density maximum and distribution modality, correlation time,
number of surges, density of maxima and minima, characteristic distribution function,
coefficients of asymmetry, excess, measure of skewness, etc.
The choice of parameters, which are optimal and most sensitive to changes of
surface blood flow, is a rather laborious computational task. Analogous studies
conducted for determination of the tone of the muscle tissue showed that fluctuation power suffers the greatest alteration. But the high-frequency spectrum tail,
which is changeable during amplification/abatement of the blood flow, embraces a
small area. Dynamic range of the change of the spectrum area is about 10% of the
whole spectrum area. As characteristic frequencies of boiling the speckle-structure
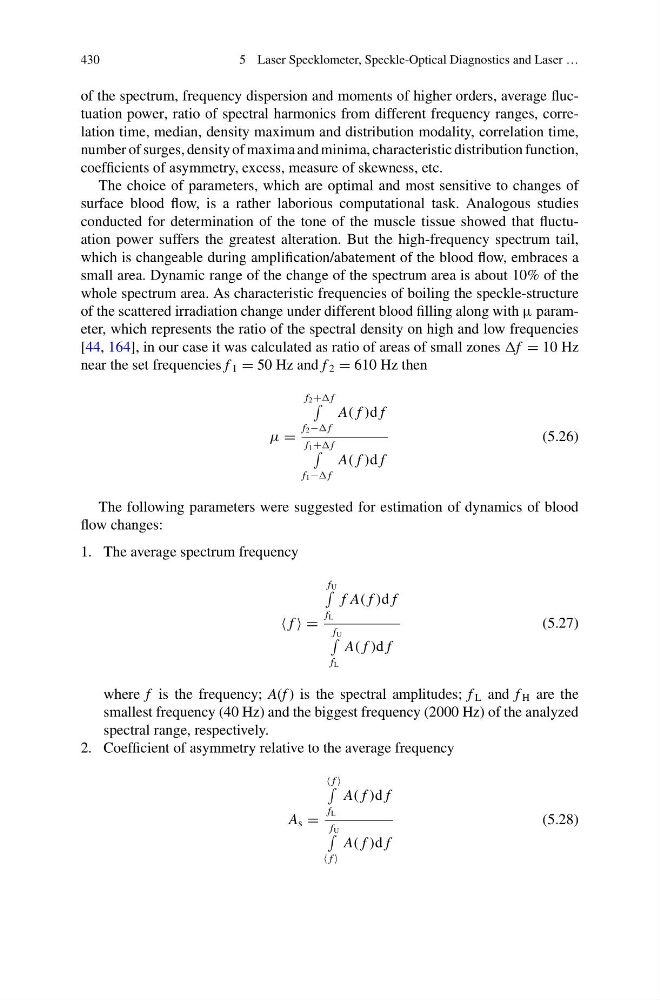
of the scattered irradiation change under different blood filling along with μ parameter, which represents the ratio of the spectral density on high and low frequencies
[44, 164], in our case it was calculated as ratio of areas of small zones f = 10 Hz
near the set frequencies f 1 = 50 Hz and f 2 = 610 Hz then
μ =
f 2 + f
f 2 − f
A( f )d f
f 1 + f
f 1 − f
A( f )d f
(5.26)
The following parameters were suggested for estimation of dynamics of blood
flow changes:
1. The average spectrum frequency
f =
f U
f L
f A( f )d f
f U
f L
A( f )d f
(5.27)
where f is the frequency; A(f ) is the spectral amplitudes; f L and f H are the
smallest frequency (40 Hz) and the biggest frequency (2000 Hz) of the analyzed
spectral range, respectively.
2. Coefficient of asymmetry relative to the average frequency
A s =
f
f L
A( f )d f
f U
f
A( f )d f
(5.28)
5 Laser Specklometer, Speckle-Optical Diagnostics and Laser …
of the spectrum, frequency dispersion and moments of higher orders, average fluctuation power, ratio of spectral harmonics from different frequency ranges, correlation time, median, density maximum and distribution modality, correlation time,
number of surges, density of maxima and minima, characteristic distribution function,
coefficients of asymmetry, excess, measure of skewness, etc.
The choice of parameters, which are optimal and most sensitive to changes of
surface blood flow, is a rather laborious computational task. Analogous studies
conducted for determination of the tone of the muscle tissue showed that fluctuation power suffers the greatest alteration. But the high-frequency spectrum tail,
which is changeable during amplification/abatement of the blood flow, embraces a
small area. Dynamic range of the change of the spectrum area is about 10% of the
whole spectrum area. As characteristic frequencies of boiling the speckle-structure
of the scattered irradiation change under different blood filling along with μ parameter, which represents the ratio of the spectral density on high and low frequencies
[44, 164], in our case it was calculated as ratio of areas of small zones f = 10 Hz
near the set frequencies f 1 = 50 Hz and f 2 = 610 Hz then
μ =
f 2 + f
f 2 − f
A( f )d f
f 1 + f
f 1 − f
A( f )d f
(5.26)
The following parameters were suggested for estimation of dynamics of blood
flow changes:
1. The average spectrum frequency
f =
f U
f L
f A( f )d f
f U
f L
A( f )d f
(5.27)
where f is the frequency; A(f ) is the spectral amplitudes; f L and f H are the
smallest frequency (40 Hz) and the biggest frequency (2000 Hz) of the analyzed
spectral range, respectively.
2. Coefficient of asymmetry relative to the average frequency
A s =
f
f L
A( f )d f
f U
f
A( f )d f
(5.28)