

3.1 The Holographic Method of Contouring of Static …
221
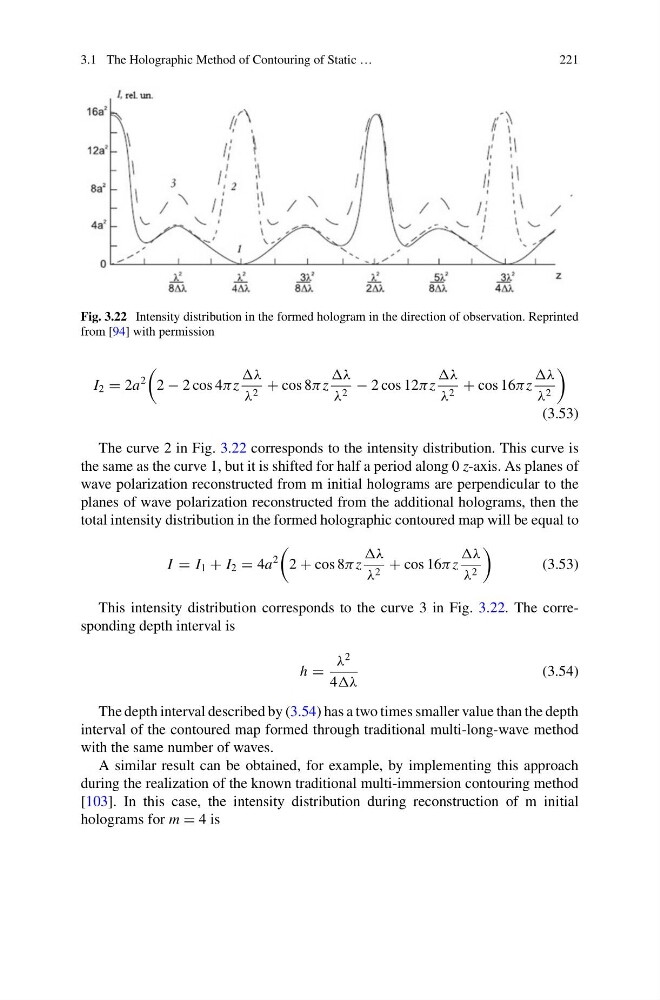
Fig. 3.22 Intensity distribution in the formed hologram in the direction of observation. Reprinted
from [94] with permission
I 2 = 2a
2
2 − 2 cos 4π z
λ
λ 2 + cos 8π z
λ
λ 2 − 2 cos 12π z
λ
λ 2 + cos 16π z
λ
λ 2
(3.53)
The curve 2 in Fig. 3.22 corresponds to the intensity distribution. This curve is
the same as the curve 1, but it is shifted for half a period along 0 z-axis. As planes of
wave polarization reconstructed from m initial holograms are perpendicular to the
planes of wave polarization reconstructed from the additional holograms, then the
total intensity distribution in the formed holographic contoured map will be equal to
I = I 1 + I 2 = 4a
2
2 + cos 8π z
λ
λ 2 + cos 16π z
λ
λ 2
(3.53)
This intensity distribution corresponds to the curve 3 in Fig. 3.22. The corresponding depth interval is
h =
λ
2
4λ
(3.54)
The depth interval described by (3.54) has a two times smaller value than the depth
interval of the contoured map formed through traditional multi-long-wave method
with the same number of waves.
A similar result can be obtained, for example, by implementing this approach
during the realization of the known traditional multi-immersion contouring method
[103]. In this case, the intensity distribution during reconstruction of m initial
holograms for m = 4 is
221
Fig. 3.22 Intensity distribution in the formed hologram in the direction of observation. Reprinted
from [94] with permission
I 2 = 2a
2
2 − 2 cos 4π z
λ
λ 2 + cos 8π z
λ
λ 2 − 2 cos 12π z
λ
λ 2 + cos 16π z
λ
λ 2
(3.53)
The curve 2 in Fig. 3.22 corresponds to the intensity distribution. This curve is
the same as the curve 1, but it is shifted for half a period along 0 z-axis. As planes of
wave polarization reconstructed from m initial holograms are perpendicular to the
planes of wave polarization reconstructed from the additional holograms, then the
total intensity distribution in the formed holographic contoured map will be equal to
I = I 1 + I 2 = 4a
2
2 + cos 8π z
λ
λ 2 + cos 16π z
λ
λ 2
(3.53)
This intensity distribution corresponds to the curve 3 in Fig. 3.22. The corresponding depth interval is
h =
λ
2
4λ
(3.54)
The depth interval described by (3.54) has a two times smaller value than the depth
interval of the contoured map formed through traditional multi-long-wave method
with the same number of waves.
A similar result can be obtained, for example, by implementing this approach
during the realization of the known traditional multi-immersion contouring method
[103]. In this case, the intensity distribution during reconstruction of m initial
holograms for m = 4 is