

3.1 The Holographic Method of Contouring of Static …
203
The refractive index was controlled with a refractometer and corresponded well
with a value calculated using to the Kramers–Kronig relation. After exposure, the
chamber was cleaned of the rests of the solution and was dried for 10 min to eliminate
the residual drops of the liquid, which could lead to some dilution of the second
solution used. As the second immersion, a mixture of distilled water and ethyl alcohol
was used. The refractive index of the solution was 1.3336. These two liquids provide
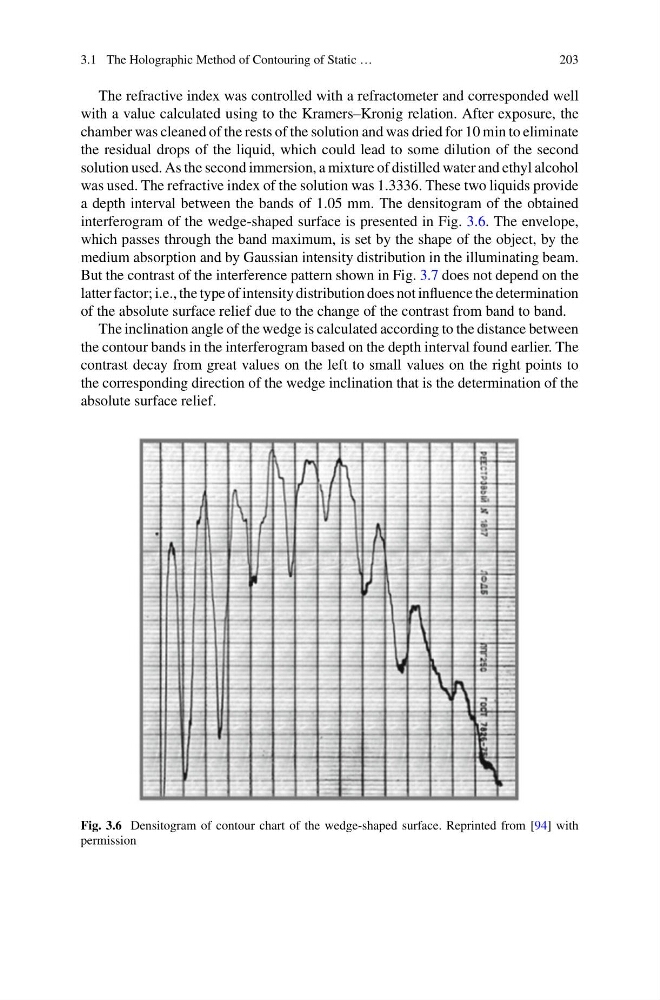
a depth interval between the bands of 1.05 mm. The densitogram of the obtained
interferogram of the wedge-shaped surface is presented in Fig. 3.6. The envelope,
which passes through the band maximum, is set by the shape of the object, by the
medium absorption and by Gaussian intensity distribution in the illuminating beam.
But the contrast of the interference pattern shown in Fig. 3.7 does not depend on the
latter factor; i.e., the type of intensity distribution does not influence the determination
of the absolute surface relief due to the change of the contrast from band to band.
The inclination angle of the wedge is calculated according to the distance between
the contour bands in the interferogram based on the depth interval found earlier. The
contrast decay from great values on the left to small values on the right points to
the corresponding direction of the wedge inclination that is the determination of the
absolute surface relief.
Fig. 3.6 Densitogram of contour chart of the wedge-shaped surface. Reprinted from [94] with
permission
203
The refractive index was controlled with a refractometer and corresponded well
with a value calculated using to the Kramers–Kronig relation. After exposure, the
chamber was cleaned of the rests of the solution and was dried for 10 min to eliminate
the residual drops of the liquid, which could lead to some dilution of the second
solution used. As the second immersion, a mixture of distilled water and ethyl alcohol
was used. The refractive index of the solution was 1.3336. These two liquids provide
a depth interval between the bands of 1.05 mm. The densitogram of the obtained
interferogram of the wedge-shaped surface is presented in Fig. 3.6. The envelope,
which passes through the band maximum, is set by the shape of the object, by the
medium absorption and by Gaussian intensity distribution in the illuminating beam.
But the contrast of the interference pattern shown in Fig. 3.7 does not depend on the
latter factor; i.e., the type of intensity distribution does not influence the determination
of the absolute surface relief due to the change of the contrast from band to band.
The inclination angle of the wedge is calculated according to the distance between
the contour bands in the interferogram based on the depth interval found earlier. The
contrast decay from great values on the left to small values on the right points to
the corresponding direction of the wedge inclination that is the determination of the
absolute surface relief.
Fig. 3.6 Densitogram of contour chart of the wedge-shaped surface. Reprinted from [94] with
permission