

2.2 Holographic Study of Structural and Functional Characteristics …
99
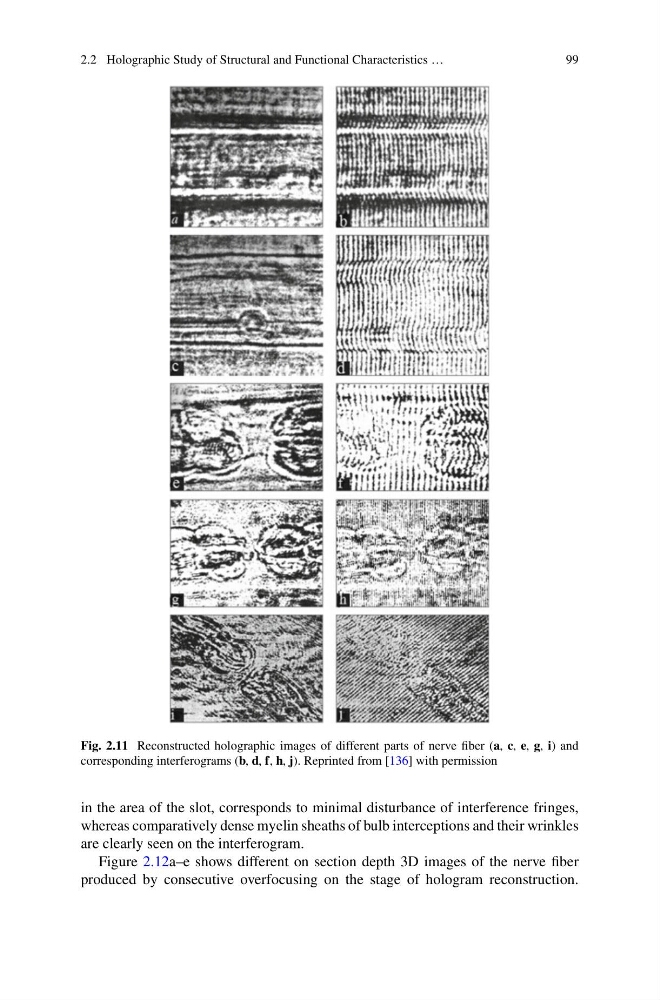
Fig. 2.11 Reconstructed holographic images of different parts of nerve fiber (a, c, e, g, i) and
corresponding interferograms (b, d, f, h, j). Reprinted from [136] with permission
in the area of the slot, corresponds to minimal disturbance of interference fringes,
whereas comparatively dense myelin sheaths of bulb interceptions and their wrinkles
are clearly seen on the interferogram.
Figure 2.12a–e shows different on section depth 3D images of the nerve fiber
produced by consecutive overfocusing on the stage of hologram reconstruction.
99
Fig. 2.11 Reconstructed holographic images of different parts of nerve fiber (a, c, e, g, i) and
corresponding interferograms (b, d, f, h, j). Reprinted from [136] with permission
in the area of the slot, corresponds to minimal disturbance of interference fringes,
whereas comparatively dense myelin sheaths of bulb interceptions and their wrinkles
are clearly seen on the interferogram.
Figure 2.12a–e shows different on section depth 3D images of the nerve fiber
produced by consecutive overfocusing on the stage of hologram reconstruction.