

14
2 State-of-the-Art TFET Devices
Supply Voltage (V)
0.6
0.7
0.8
0.9
1.0
P Dynamic-CMOS
P Dynamic-TFET
P Static-CMOS
P Static-TFET
10
-05
10
-07
10
-09
10
-11
10
-13
10
-15
Power (W)
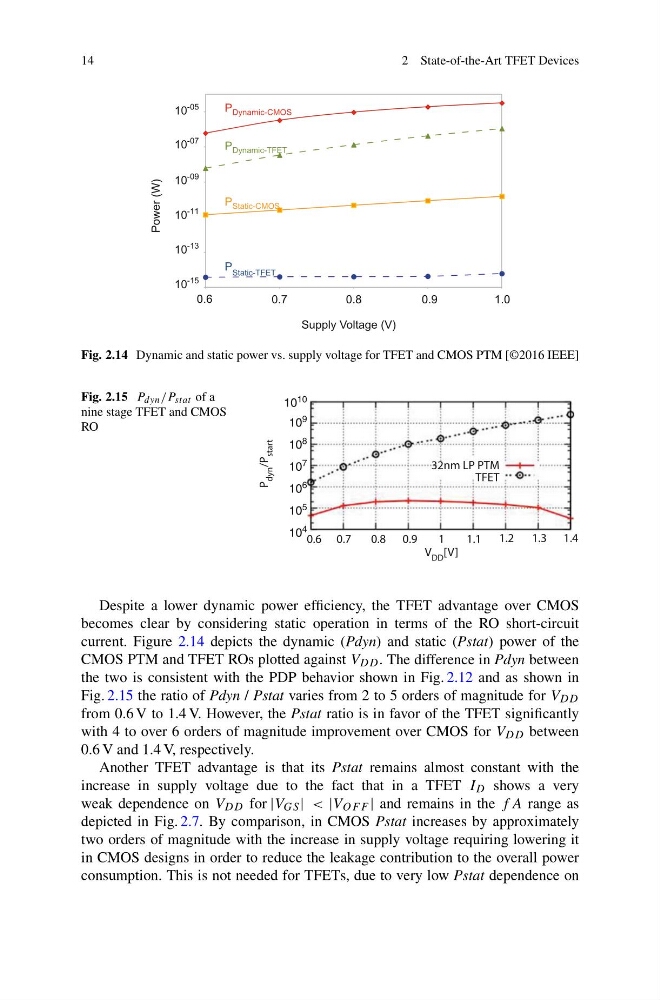
Fig. 2.14 Dynamic and static power vs. supply voltage for TFET and CMOS PTM [©2016 IEEE]
Fig. 2.15 P dyn /P stat of a
nine stage TFET and CMOS
RO
0.6 0.7
0.8 0.9
V DD [V]
32nm LP PTM
TFET
1
1.1 1.2 1.3 1.4
10
10
10
9
10
8
10
7
10
6
10
5
10
4
P
dyn
/P
start
Despite a lower dynamic power efficiency, the TFET advantage over CMOS
becomes clear by considering static operation in terms of the RO short-circuit
current. Figure 2.14 depicts the dynamic (Pdyn) and static (Pstat) power of the
CMOS PTM and TFET ROs plotted against V DD . The difference in Pdyn between
the two is consistent with the PDP behavior shown in Fig. 2.12 and as shown in
Fig. 2.15 the ratio of Pdyn / Pstat varies from 2 to 5 orders of magnitude for V DD
from 0.6 V to 1.4 V. However, the Pstat ratio is in favor of the TFET significantly
with 4 to over 6 orders of magnitude improvement over CMOS for V DD between
0.6 V and 1.4 V, respectively.
Another TFET advantage is that its Pstat remains almost constant with the
increase in supply voltage due to the fact that in a TFET I D shows a very
weak dependence on V DD for |V GS | < |V OF F | and remains in the f A range as
depicted in Fig. 2.7. By comparison, in CMOS Pstat increases by approximately
two orders of magnitude with the increase in supply voltage requiring lowering it
in CMOS designs in order to reduce the leakage contribution to the overall power
consumption. This is not needed for TFETs, due to very low Pstat dependence on
2 State-of-the-Art TFET Devices
Supply Voltage (V)
0.6
0.7
0.8
0.9
1.0
P Dynamic-CMOS
P Dynamic-TFET
P Static-CMOS
P Static-TFET
10
-05
10
-07
10
-09
10
-11
10
-13
10
-15
Power (W)
Fig. 2.14 Dynamic and static power vs. supply voltage for TFET and CMOS PTM [©2016 IEEE]
Fig. 2.15 P dyn /P stat of a
nine stage TFET and CMOS
RO
0.6 0.7
0.8 0.9
V DD [V]
32nm LP PTM
TFET
1
1.1 1.2 1.3 1.4
10
10
10
9
10
8
10
7
10
6
10
5
10
4
P
dyn
/P
start
Despite a lower dynamic power efficiency, the TFET advantage over CMOS
becomes clear by considering static operation in terms of the RO short-circuit
current. Figure 2.14 depicts the dynamic (Pdyn) and static (Pstat) power of the
CMOS PTM and TFET ROs plotted against V DD . The difference in Pdyn between
the two is consistent with the PDP behavior shown in Fig. 2.12 and as shown in
Fig. 2.15 the ratio of Pdyn / Pstat varies from 2 to 5 orders of magnitude for V DD
from 0.6 V to 1.4 V. However, the Pstat ratio is in favor of the TFET significantly
with 4 to over 6 orders of magnitude improvement over CMOS for V DD between
0.6 V and 1.4 V, respectively.
Another TFET advantage is that its Pstat remains almost constant with the
increase in supply voltage due to the fact that in a TFET I D shows a very
weak dependence on V DD for |V GS | < |V OF F | and remains in the f A range as
depicted in Fig. 2.7. By comparison, in CMOS Pstat increases by approximately
two orders of magnitude with the increase in supply voltage requiring lowering it
in CMOS designs in order to reduce the leakage contribution to the overall power
consumption. This is not needed for TFETs, due to very low Pstat dependence on