

66
3 Modeling Composite Structures
Z Ohms
90
90
80
70
60
50
40
30
20
80
70
60
50
40
30
20
10
10
0
0
60
60
80
80
40
40
20
20
0
0
Re cta ng ula r X, mm
Re cta ng ula r y, m m
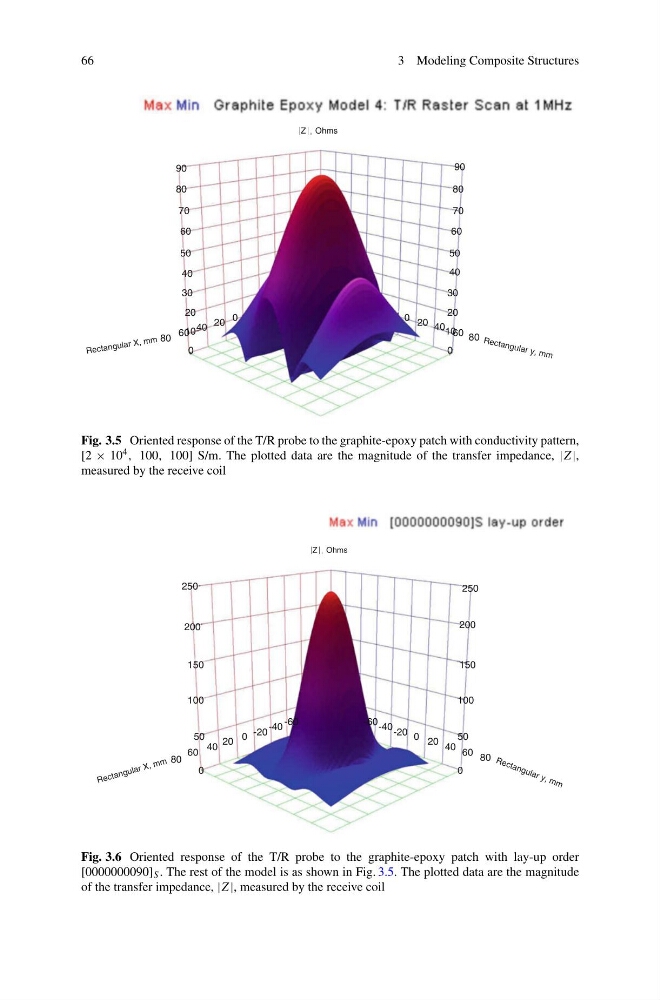
Fig. 3.5 Oriented response of the T/R probe to the graphite-epoxy patch with conductivity pattern,
[2 × 10 4 , 100, 100] S/m. The plotted data are the magnitude of the transfer impedance, |Z|,
measured by the receive coil
Z Ohms
250
200
150
100
250
200
150
100
50
50
80
80
60
60
40
40
20
20
0
0
-20
-20
-40
-40
-60
-60
0
0
R ec ta ng ul ar X , m m
R e ct a n g u la r y, m m
Fig. 3.6 Oriented response of the T/R probe to the graphite-epoxy patch with lay-up order
[0000000090] S . The rest of the model is as shown in Fig. 3.5. The plotted data are the magnitude
of the transfer impedance, |Z|, measured by the receive coil
3 Modeling Composite Structures
Z Ohms
90
90
80
70
60
50
40
30
20
80
70
60
50
40
30
20
10
10
0
0
60
60
80
80
40
40
20
20
0
0
Re cta ng ula r X, mm
Re cta ng ula r y, m m
Fig. 3.5 Oriented response of the T/R probe to the graphite-epoxy patch with conductivity pattern,
[2 × 10 4 , 100, 100] S/m. The plotted data are the magnitude of the transfer impedance, |Z|,
measured by the receive coil
Z Ohms
250
200
150
100
250
200
150
100
50
50
80
80
60
60
40
40
20
20
0
0
-20
-20
-40
-40
-60
-60
0
0
R ec ta ng ul ar X , m m
R e ct a n g u la r y, m m
Fig. 3.6 Oriented response of the T/R probe to the graphite-epoxy patch with lay-up order
[0000000090] S . The rest of the model is as shown in Fig. 3.5. The plotted data are the magnitude
of the transfer impedance, |Z|, measured by the receive coil