

3.3 Example Calculations Using VIC-3D®
65
Z Ohms
350
300
250
200
150
100
350
300
250
200
150
100
80
80
60
60
50
50
40
40
20
20
0
0
-20
-20
-40
-40
-60
-60
0
0
R e c ta n g u la r X , m m
Re cta ng ula r y, m m
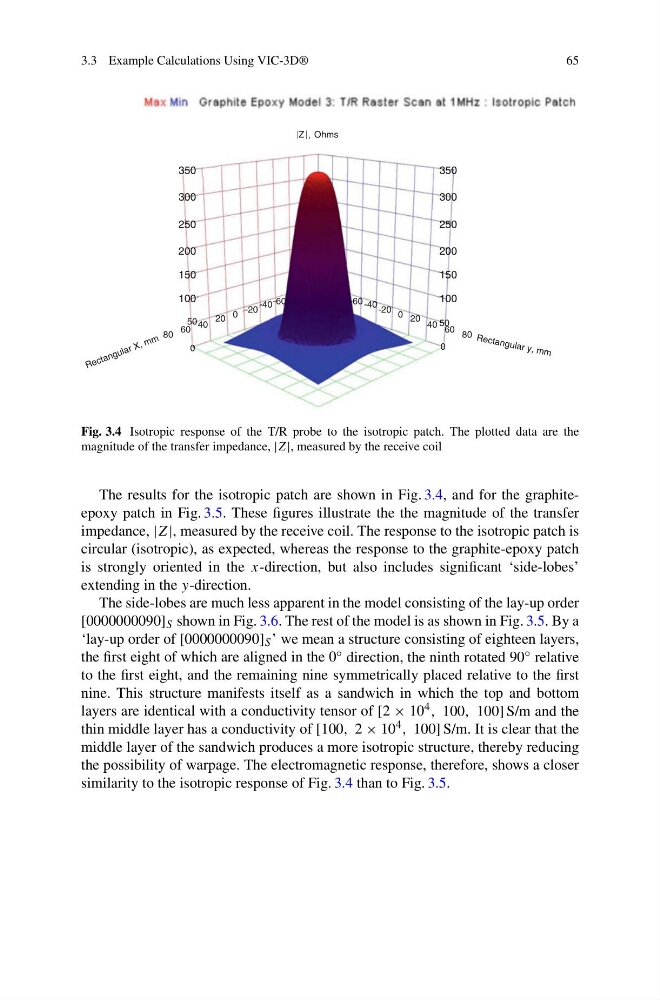
Fig. 3.4 Isotropic response of the T/R probe to the isotropic patch. The plotted data are the
magnitude of the transfer impedance, |Z|, measured by the receive coil
The results for the isotropic patch are shown in Fig. 3.4, and for the graphiteepoxy patch in Fig. 3.5. These figures illustrate the the magnitude of the transfer
impedance, |Z|, measured by the receive coil. The response to the isotropic patch is
circular (isotropic), as expected, whereas the response to the graphite-epoxy patch
is strongly oriented in the x-direction, but also includes significant ‘side-lobes’
extending in the y-direction.
The side-lobes are much less apparent in the model consisting of the lay-up order
[0000000090] S shown in Fig. 3.6. The rest of the model is as shown in Fig. 3.5. By a
‘lay-up order of [0000000090] S ’ we mean a structure consisting of eighteen layers,
the first eight of which are aligned in the 0 ◦ direction, the ninth rotated 90 ◦ relative
to the first eight, and the remaining nine symmetrically placed relative to the first
nine. This structure manifests itself as a sandwich in which the top and bottom
layers are identical with a conductivity tensor of [2 × 10 4 , 100, 100] S/m and the
thin middle layer has a conductivity of [100, 2 × 10 4 , 100] S/m. It is clear that the
middle layer of the sandwich produces a more isotropic structure, thereby reducing
the possibility of warpage. The electromagnetic response, therefore, shows a closer
similarity to the isotropic response of Fig. 3.4 than to Fig. 3.5.
65
Z Ohms
350
300
250
200
150
100
350
300
250
200
150
100
80
80
60
60
50
50
40
40
20
20
0
0
-20
-20
-40
-40
-60
-60
0
0
R e c ta n g u la r X , m m
Re cta ng ula r y, m m
Fig. 3.4 Isotropic response of the T/R probe to the isotropic patch. The plotted data are the
magnitude of the transfer impedance, |Z|, measured by the receive coil
The results for the isotropic patch are shown in Fig. 3.4, and for the graphiteepoxy patch in Fig. 3.5. These figures illustrate the the magnitude of the transfer
impedance, |Z|, measured by the receive coil. The response to the isotropic patch is
circular (isotropic), as expected, whereas the response to the graphite-epoxy patch
is strongly oriented in the x-direction, but also includes significant ‘side-lobes’
extending in the y-direction.
The side-lobes are much less apparent in the model consisting of the lay-up order
[0000000090] S shown in Fig. 3.6. The rest of the model is as shown in Fig. 3.5. By a
‘lay-up order of [0000000090] S ’ we mean a structure consisting of eighteen layers,
the first eight of which are aligned in the 0 ◦ direction, the ninth rotated 90 ◦ relative
to the first eight, and the remaining nine symmetrically placed relative to the first
nine. This structure manifests itself as a sandwich in which the top and bottom
layers are identical with a conductivity tensor of [2 × 10 4 , 100, 100] S/m and the
thin middle layer has a conductivity of [100, 2 × 10 4 , 100] S/m. It is clear that the
middle layer of the sandwich produces a more isotropic structure, thereby reducing
the possibility of warpage. The electromagnetic response, therefore, shows a closer
similarity to the isotropic response of Fig. 3.4 than to Fig. 3.5.