

318
12 Carbon-Nanotube Reinforced Polymers
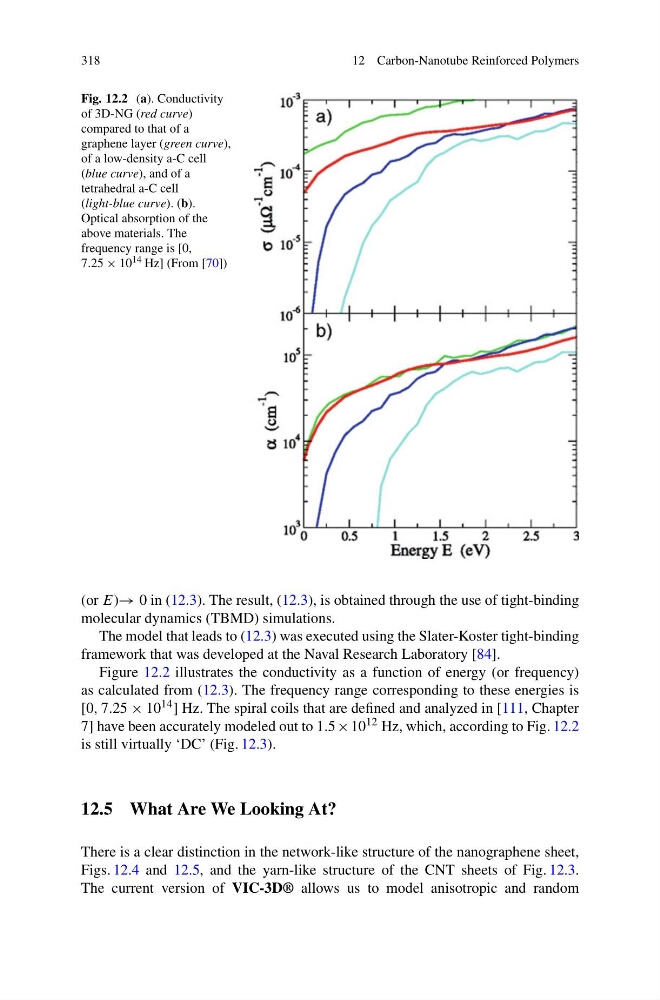
Fig. 12.2 (a). Conductivity
of 3D-NG (red curve)
compared to that of a
graphene layer (green curve),
of a low-density a-C cell
(blue curve), and of a
tetrahedral a-C cell
(light-blue curve). (b).
Optical absorption of the
above materials. The
frequency range is [0,
7.25 × 10 14 Hz] (From [70])
(or E)→ 0 in (12.3). The result, (12.3), is obtained through the use of tight-binding
molecular dynamics (TBMD) simulations.
The model that leads to (12.3) was executed using the Slater-Koster tight-binding
framework that was developed at the Naval Research Laboratory [84].
Figure 12.2 illustrates the conductivity as a function of energy (or frequency)
as calculated from (12.3). The frequency range corresponding to these energies is
[0, 7.25 × 10 14 ] Hz. The spiral coils that are defined and analyzed in [111, Chapter
7] have been accurately modeled out to 1.5 × 10 12 Hz, which, according to Fig. 12.2
is still virtually ‘DC’ (Fig. 12.3).
12.5 What Are We Looking At?
There is a clear distinction in the network-like structure of the nanographene sheet,
Figs. 12.4 and 12.5, and the yarn-like structure of the CNT sheets of Fig. 12.3.
The current version of VIC-3D® allows us to model anisotropic and random
12 Carbon-Nanotube Reinforced Polymers
Fig. 12.2 (a). Conductivity
of 3D-NG (red curve)
compared to that of a
graphene layer (green curve),
of a low-density a-C cell
(blue curve), and of a
tetrahedral a-C cell
(light-blue curve). (b).
Optical absorption of the
above materials. The
frequency range is [0,
7.25 × 10 14 Hz] (From [70])
(or E)→ 0 in (12.3). The result, (12.3), is obtained through the use of tight-binding
molecular dynamics (TBMD) simulations.
The model that leads to (12.3) was executed using the Slater-Koster tight-binding
framework that was developed at the Naval Research Laboratory [84].
Figure 12.2 illustrates the conductivity as a function of energy (or frequency)
as calculated from (12.3). The frequency range corresponding to these energies is
[0, 7.25 × 10 14 ] Hz. The spiral coils that are defined and analyzed in [111, Chapter
7] have been accurately modeled out to 1.5 × 10 12 Hz, which, according to Fig. 12.2
is still virtually ‘DC’ (Fig. 12.3).
12.5 What Are We Looking At?
There is a clear distinction in the network-like structure of the nanographene sheet,
Figs. 12.4 and 12.5, and the yarn-like structure of the CNT sheets of Fig. 12.3.
The current version of VIC-3D® allows us to model anisotropic and random