

12.5 What Are We Looking At?
319
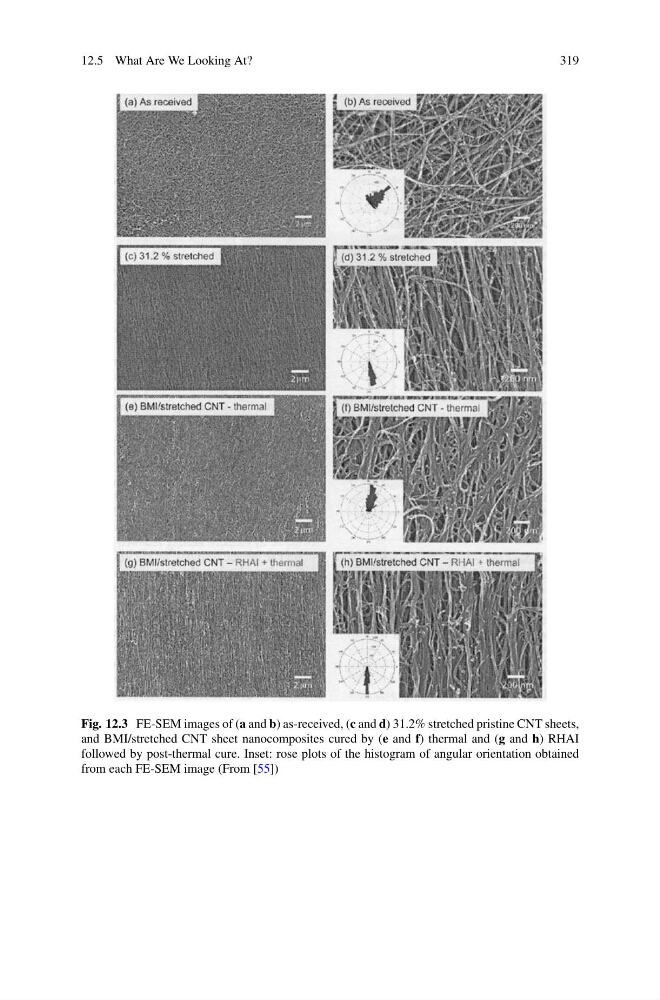
Fig. 12.3 FE-SEM images of (a and b) as-received, (c and d) 31.2% stretched pristine CNT sheets,
and BMI/stretched CNT sheet nanocomposites cured by (e and f) thermal and (g and h) RHAI
followed by post-thermal cure. Inset: rose plots of the histogram of angular orientation obtained
from each FE-SEM image (From [55])
319
Fig. 12.3 FE-SEM images of (a and b) as-received, (c and d) 31.2% stretched pristine CNT sheets,
and BMI/stretched CNT sheet nanocomposites cured by (e and f) thermal and (g and h) RHAI
followed by post-thermal cure. Inset: rose plots of the histogram of angular orientation obtained
from each FE-SEM image (From [55])