

10.4 Lesion 2
259
Table 10.9 Results of
application of eight-layer
inversion algorithm during
the second iteration for lesion
2. The Levenberg–Marquardt
parameter is 0.0001
Lesion no.
Layer Upper boundary (mm) Variation 2
1
−0.12
0.128
2
−0.21
0.223
3
−0.30
0.310
4
−0.39
0.369
5
−0.72
0.427
6
−0.78
0.412
7
−0.84
0.393
8
−0.90
0.0
Table 10.10 Results of
application of eight-layer
inversion algorithm during
the third iteration for lesion 2.
The Levenberg–Marquardt
parameter is 5 × 10 −5
Lesion no.
Layer Upper boundary (mm) Variation 2
1
−0.12
0.037
2
−0.15375
0.1523
3
−0.1875
0.2086
4
−0.22125
0.2345
5
−0.255
0.2414
6
−0.28875
0.2351
7
−0.3225
0.2209
8
−0.35625
0.1993
Table 10.11 Results of
application of eight-layer
inversion algorithm during
the fourth iteration for lesion
2. The Levenberg–Marquardt
parameter is 5 × 10 −5
Lesion no.
Layer Upper boundary (mm) Variation 2
1
−0.12
0.047
2
−0.155
0.148
3
−0.190
0.202
4
−0.225
0.231
5
−0.26
0.244
6
−0.295
0.247
7
−0.33
0.242
8
−0.365
0.230
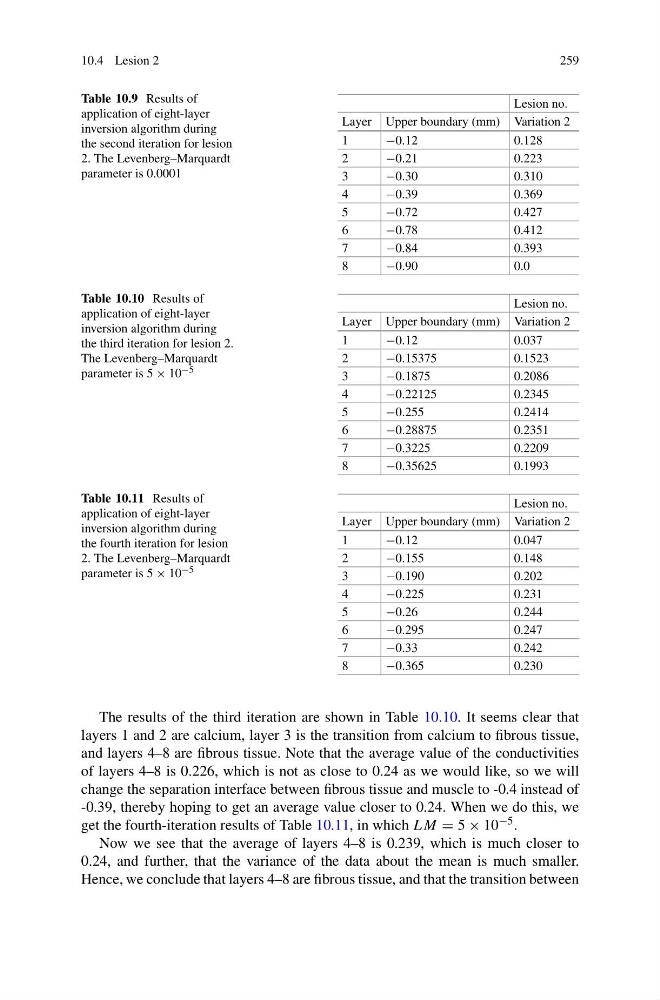
The results of the third iteration are shown in Table 10.10. It seems clear that
layers 1 and 2 are calcium, layer 3 is the transition from calcium to fibrous tissue,
and layers 4–8 are fibrous tissue. Note that the average value of the conductivities
of layers 4–8 is 0.226, which is not as close to 0.24 as we would like, so we will
change the separation interface between fibrous tissue and muscle to -0.4 instead of
-0.39, thereby hoping to get an average value closer to 0.24. When we do this, we
get the fourth-iteration results of Table 10.11, in which LM = 5 × 10 −5 .
Now we see that the average of layers 4–8 is 0.239, which is much closer to
0.24, and further, that the variance of the data about the mean is much smaller.
Hence, we conclude that layers 4–8 are fibrous tissue, and that the transition between
259
Table 10.9 Results of
application of eight-layer
inversion algorithm during
the second iteration for lesion
2. The Levenberg–Marquardt
parameter is 0.0001
Lesion no.
Layer Upper boundary (mm) Variation 2
1
−0.12
0.128
2
−0.21
0.223
3
−0.30
0.310
4
−0.39
0.369
5
−0.72
0.427
6
−0.78
0.412
7
−0.84
0.393
8
−0.90
0.0
Table 10.10 Results of
application of eight-layer
inversion algorithm during
the third iteration for lesion 2.
The Levenberg–Marquardt
parameter is 5 × 10 −5
Lesion no.
Layer Upper boundary (mm) Variation 2
1
−0.12
0.037
2
−0.15375
0.1523
3
−0.1875
0.2086
4
−0.22125
0.2345
5
−0.255
0.2414
6
−0.28875
0.2351
7
−0.3225
0.2209
8
−0.35625
0.1993
Table 10.11 Results of
application of eight-layer
inversion algorithm during
the fourth iteration for lesion
2. The Levenberg–Marquardt
parameter is 5 × 10 −5
Lesion no.
Layer Upper boundary (mm) Variation 2
1
−0.12
0.047
2
−0.155
0.148
3
−0.190
0.202
4
−0.225
0.231
5
−0.26
0.244
6
−0.295
0.247
7
−0.33
0.242
8
−0.365
0.230
The results of the third iteration are shown in Table 10.10. It seems clear that
layers 1 and 2 are calcium, layer 3 is the transition from calcium to fibrous tissue,
and layers 4–8 are fibrous tissue. Note that the average value of the conductivities
of layers 4–8 is 0.226, which is not as close to 0.24 as we would like, so we will
change the separation interface between fibrous tissue and muscle to -0.4 instead of
-0.39, thereby hoping to get an average value closer to 0.24. When we do this, we
get the fourth-iteration results of Table 10.11, in which LM = 5 × 10 −5 .
Now we see that the average of layers 4–8 is 0.239, which is much closer to
0.24, and further, that the variance of the data about the mean is much smaller.
Hence, we conclude that layers 4–8 are fibrous tissue, and that the transition between