

258
10 Characterization of Atherosclerotic Lesions by Inversion of Eddy-. . .
Table 10.7 Final results for
the reconstructed original
lesion
Thickness (mm)
Material
Computed Original
Calcium
0.1
0.1
Fibrous Tissue
0.29985
0.3
Smooth Muscle 0.2936
0.3
Lipid
1.00655
1.0
Table 10.8 Results of
application of eight-layer
inversion algorithm using the
right-hand part of Fig. 10.6.
The Levenberg–Marquardt
Parameter is 0.00025
Lesion no.
Layer Upper boundary (mm) Variation 2
1
0
0.0791
2
−0.12
0.1758
3
−0.24
0.3072
4
−0.36
0.3822
5
−0.48
0.4092
6
−0.60
0.3951
7
−0.72
0.3463
8
−0.84
0.2687
10.4 Lesion 2
Now, we’ll go on to reconstruct Lesion 2, starting with the grid on the right-hand
side of Fig. 10.6. Using a Levenberg–Marquardt parameter value of 0.00025, the
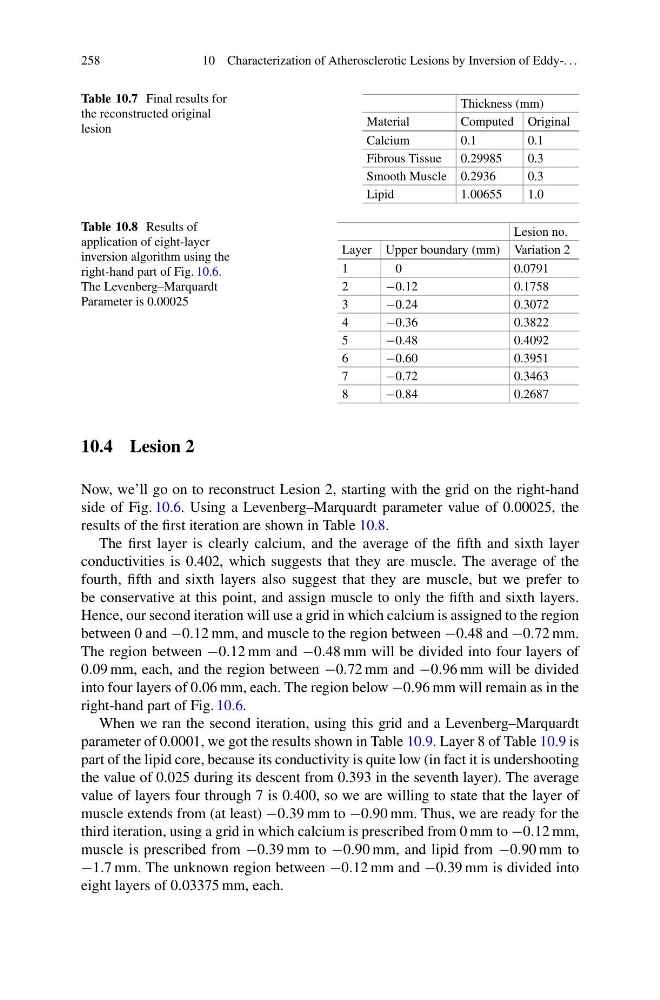
results of the first iteration are shown in Table 10.8.
The first layer is clearly calcium, and the average of the fifth and sixth layer
conductivities is 0.402, which suggests that they are muscle. The average of the
fourth, fifth and sixth layers also suggest that they are muscle, but we prefer to
be conservative at this point, and assign muscle to only the fifth and sixth layers.
Hence, our second iteration will use a grid in which calcium is assigned to the region
between 0 and −0.12 mm, and muscle to the region between −0.48 and −0.72 mm.
The region between −0.12 mm and −0.48 mm will be divided into four layers of
0.09 mm, each, and the region between −0.72 mm and −0.96 mm will be divided
into four layers of 0.06 mm, each. The region below −0.96 mm will remain as in the
right-hand part of Fig. 10.6.
When we ran the second iteration, using this grid and a Levenberg–Marquardt
parameter of 0.0001, we got the results shown in Table 10.9. Layer 8 of Table 10.9 is
part of the lipid core, because its conductivity is quite low (in fact it is undershooting
the value of 0.025 during its descent from 0.393 in the seventh layer). The average
value of layers four through 7 is 0.400, so we are willing to state that the layer of
muscle extends from (at least) −0.39 mm to −0.90 mm. Thus, we are ready for the
third iteration, using a grid in which calcium is prescribed from 0 mm to −0.12 mm,
muscle is prescribed from −0.39 mm to −0.90 mm, and lipid from −0.90 mm to
−1.7 mm. The unknown region between −0.12 mm and −0.39 mm is divided into
eight layers of 0.03375 mm, each.
10 Characterization of Atherosclerotic Lesions by Inversion of Eddy-. . .
Table 10.7 Final results for
the reconstructed original
lesion
Thickness (mm)
Material
Computed Original
Calcium
0.1
0.1
Fibrous Tissue
0.29985
0.3
Smooth Muscle 0.2936
0.3
Lipid
1.00655
1.0
Table 10.8 Results of
application of eight-layer
inversion algorithm using the
right-hand part of Fig. 10.6.
The Levenberg–Marquardt
Parameter is 0.00025
Lesion no.
Layer Upper boundary (mm) Variation 2
1
0
0.0791
2
−0.12
0.1758
3
−0.24
0.3072
4
−0.36
0.3822
5
−0.48
0.4092
6
−0.60
0.3951
7
−0.72
0.3463
8
−0.84
0.2687
10.4 Lesion 2
Now, we’ll go on to reconstruct Lesion 2, starting with the grid on the right-hand
side of Fig. 10.6. Using a Levenberg–Marquardt parameter value of 0.00025, the
results of the first iteration are shown in Table 10.8.
The first layer is clearly calcium, and the average of the fifth and sixth layer
conductivities is 0.402, which suggests that they are muscle. The average of the
fourth, fifth and sixth layers also suggest that they are muscle, but we prefer to
be conservative at this point, and assign muscle to only the fifth and sixth layers.
Hence, our second iteration will use a grid in which calcium is assigned to the region
between 0 and −0.12 mm, and muscle to the region between −0.48 and −0.72 mm.
The region between −0.12 mm and −0.48 mm will be divided into four layers of
0.09 mm, each, and the region between −0.72 mm and −0.96 mm will be divided
into four layers of 0.06 mm, each. The region below −0.96 mm will remain as in the
right-hand part of Fig. 10.6.
When we ran the second iteration, using this grid and a Levenberg–Marquardt
parameter of 0.0001, we got the results shown in Table 10.9. Layer 8 of Table 10.9 is
part of the lipid core, because its conductivity is quite low (in fact it is undershooting
the value of 0.025 during its descent from 0.393 in the seventh layer). The average
value of layers four through 7 is 0.400, so we are willing to state that the layer of
muscle extends from (at least) −0.39 mm to −0.90 mm. Thus, we are ready for the
third iteration, using a grid in which calcium is prescribed from 0 mm to −0.12 mm,
muscle is prescribed from −0.39 mm to −0.90 mm, and lipid from −0.90 mm to
−1.7 mm. The unknown region between −0.12 mm and −0.39 mm is divided into
eight layers of 0.03375 mm, each.