

210
8 A Model for Microstructure Characterization
HTN1-cleaned 0 - 81 - nodes
distance, micrometers
X- intercept at 42.9 micrometers
Probability
1
0.9
0.8
0.7
0.6
0.5
0.4
0.3
0.2
0.1
0
0
500
1000
1500
2000
2500
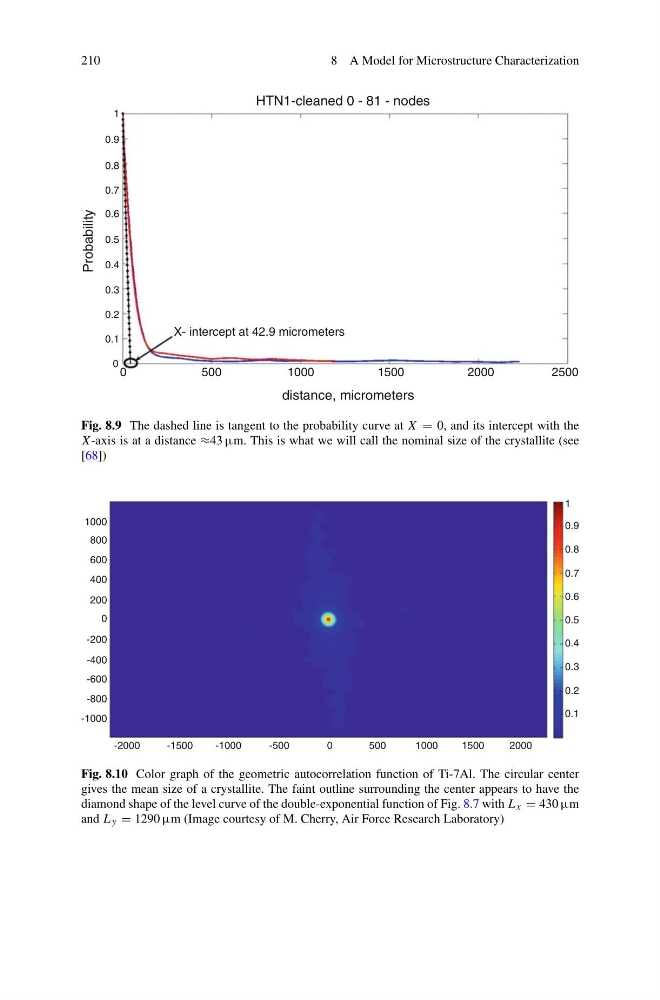
Fig. 8.9 The dashed line is tangent to the probability curve at X = 0, and its intercept with the
X-axis is at a distance ≈43 µm. This is what we will call the nominal size of the crystallite (see
[68])
1000
800
600
400
200
0
-200
-400
-600
-800
-1000
-2000
-1500
-1000
-500
0
500
1000
1500
2000
1
0.9
0.8
0.7
0.6
0.5
0.4
0.3
0.2
0.1
Fig. 8.10 Color graph of the geometric autocorrelation function of Ti-7Al. The circular center
gives the mean size of a crystallite. The faint outline surrounding the center appears to have the
diamond shape of the level curve of the double-exponential function of Fig. 8.7 with L x = 430 µm
and L y = 1290 µm (Image courtesy of M. Cherry, Air Force Research Laboratory)
8 A Model for Microstructure Characterization
HTN1-cleaned 0 - 81 - nodes
distance, micrometers
X- intercept at 42.9 micrometers
Probability
1
0.9
0.8
0.7
0.6
0.5
0.4
0.3
0.2
0.1
0
0
500
1000
1500
2000
2500
Fig. 8.9 The dashed line is tangent to the probability curve at X = 0, and its intercept with the
X-axis is at a distance ≈43 µm. This is what we will call the nominal size of the crystallite (see
[68])
1000
800
600
400
200
0
-200
-400
-600
-800
-1000
-2000
-1500
-1000
-500
0
500
1000
1500
2000
1
0.9
0.8
0.7
0.6
0.5
0.4
0.3
0.2
0.1
Fig. 8.10 Color graph of the geometric autocorrelation function of Ti-7Al. The circular center
gives the mean size of a crystallite. The faint outline surrounding the center appears to have the
diamond shape of the level curve of the double-exponential function of Fig. 8.7 with L x = 430 µm
and L y = 1290 µm (Image courtesy of M. Cherry, Air Force Research Laboratory)