

62
3 Rotatable-Polarisation Terahertz Time-Domain Spectroscopy of Anisotropic Media
0
1
2
3
4
Frequency (THz)
2.0
2.2
2.4
2.6
2.8
3.0
3.2
Refract ive Index
0
1
2
3
4
Frequency (THz)
0
2
4
6
8
10
Absorpt ion Coefficient (cm
− 1
)
0
1
2
3
4
Frequency (THz)
0.10
0.15
0.20
Birefringence
(a)
(b)
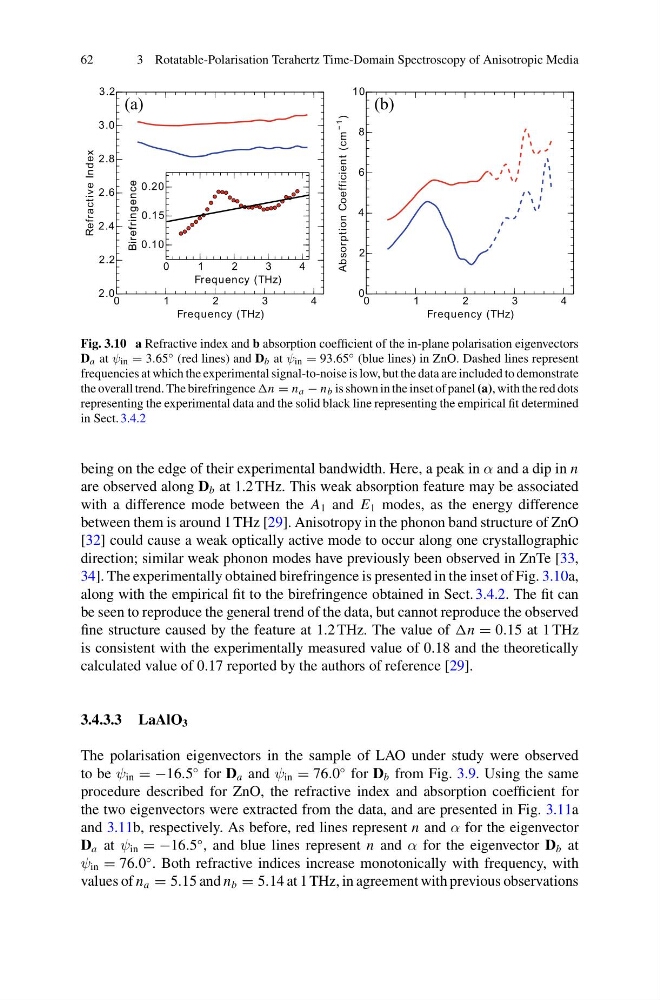
Fig. 3.10 a Refractive index and b absorption coefficient of the in-plane polarisation eigenvectors
D a at ψ in = 3.65 ◦ (red lines) and D b at ψ in = 93.65 ◦ (blue lines) in ZnO. Dashed lines represent
frequencies at which the experimental signal-to-noise is low, but the data are included to demonstrate
the overall trend. The birefringence = n a − n b is shown in the inset of panel (a), with the red dots
representing the experimental data and the solid black line representing the empirical fit determined
in Sect. 3.4.2
being on the edge of their experimental bandwidth. Here, a peak in α and a dip in n
are observed along D b at 1.2 THz. This weak absorption feature may be associated
with a difference mode between the A 1 and E 1 modes, as the energy difference
between them is around 1 THz [29]. Anisotropy in the phonon band structure of ZnO
[32] could cause a weak optically active mode to occur along one crystallographic
direction; similar weak phonon modes have previously been observed in ZnTe [33,
34]. The experimentally obtained birefringence is presented in the inset of Fig. 3.10a,
along with the empirical fit to the birefringence obtained in Sect. 3.4.2. The fit can
be seen to reproduce the general trend of the data, but cannot reproduce the observed
fine structure caused by the feature at 1.2 THz. The value of = 0.15 at 1 THz
is consistent with the experimentally measured value of 0.18 and the theoretically
calculated value of 0.17 reported by the authors of reference [29].
3.4.3.3 LaAlO 3
The polarisation eigenvectors in the sample of LAO under study were observed
to be ψ in = −16.5
◦ for D a and ψ in = 76.0
◦ for D b from Fig. 3.9. Using the same
procedure described for ZnO, the refractive index and absorption coefficient for
the two eigenvectors were extracted from the data, and are presented in Fig. 3.11a
and 3.11b, respectively. As before, red lines represent n and α for the eigenvector
D a at ψ in = −16.5
◦ , and blue lines represent n and α for the eigenvector D b at
ψ in = 76.0
◦ . Both refractive indices increase monotonically with frequency, with
values of n a = 5.15 and n b = 5.14 at 1 THz, in agreement with previous observations
3 Rotatable-Polarisation Terahertz Time-Domain Spectroscopy of Anisotropic Media
0
1
2
3
4
Frequency (THz)
2.0
2.2
2.4
2.6
2.8
3.0
3.2
Refract ive Index
0
1
2
3
4
Frequency (THz)
0
2
4
6
8
10
Absorpt ion Coefficient (cm
− 1
)
0
1
2
3
4
Frequency (THz)
0.10
0.15
0.20
Birefringence
(a)
(b)
Fig. 3.10 a Refractive index and b absorption coefficient of the in-plane polarisation eigenvectors
D a at ψ in = 3.65 ◦ (red lines) and D b at ψ in = 93.65 ◦ (blue lines) in ZnO. Dashed lines represent
frequencies at which the experimental signal-to-noise is low, but the data are included to demonstrate
the overall trend. The birefringence = n a − n b is shown in the inset of panel (a), with the red dots
representing the experimental data and the solid black line representing the empirical fit determined
in Sect. 3.4.2
being on the edge of their experimental bandwidth. Here, a peak in α and a dip in n
are observed along D b at 1.2 THz. This weak absorption feature may be associated
with a difference mode between the A 1 and E 1 modes, as the energy difference
between them is around 1 THz [29]. Anisotropy in the phonon band structure of ZnO
[32] could cause a weak optically active mode to occur along one crystallographic
direction; similar weak phonon modes have previously been observed in ZnTe [33,
34]. The experimentally obtained birefringence is presented in the inset of Fig. 3.10a,
along with the empirical fit to the birefringence obtained in Sect. 3.4.2. The fit can
be seen to reproduce the general trend of the data, but cannot reproduce the observed
fine structure caused by the feature at 1.2 THz. The value of = 0.15 at 1 THz
is consistent with the experimentally measured value of 0.18 and the theoretically
calculated value of 0.17 reported by the authors of reference [29].
3.4.3.3 LaAlO 3
The polarisation eigenvectors in the sample of LAO under study were observed
to be ψ in = −16.5
◦ for D a and ψ in = 76.0
◦ for D b from Fig. 3.9. Using the same
procedure described for ZnO, the refractive index and absorption coefficient for
the two eigenvectors were extracted from the data, and are presented in Fig. 3.11a
and 3.11b, respectively. As before, red lines represent n and α for the eigenvector
D a at ψ in = −16.5
◦ , and blue lines represent n and α for the eigenvector D b at
ψ in = 76.0
◦ . Both refractive indices increase monotonically with frequency, with
values of n a = 5.15 and n b = 5.14 at 1 THz, in agreement with previous observations