

3.4 Experimental Implementation of RP-THz-TDS
63
0.0
0.5
1.0
1.5
2.0
2.5
3.0
Frequency (THz)
4.2
4.4
4.6
4.8
5.0
5.2
5.4
5.6
Refract ive Index
0.0
0.5
1.0
1.5
2.0
2.5
3.0
Frequency (THz)
0
20
40
60
80
100
Absorpt ion Coefficient (cm
− 1
)
0.0 0.5 1.0 1.5 2.0 2.5
Frequency (THz)
0.00
0.01
0.02
0.03
0.04
0.05
Birefringence
(a)
(b)
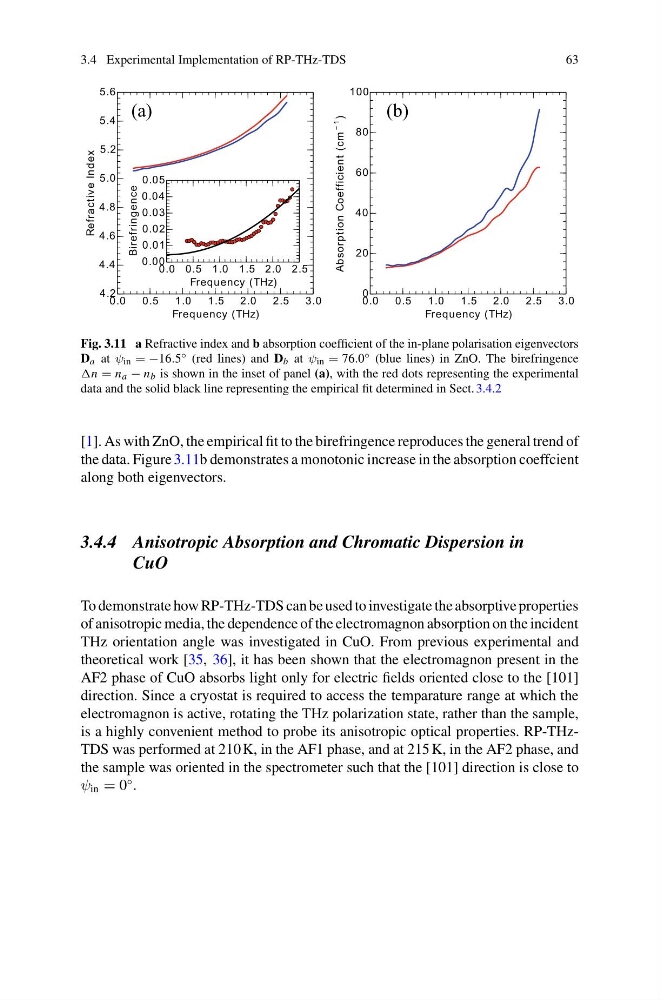
Fig. 3.11 a Refractive index and b absorption coefficient of the in-plane polarisation eigenvectors
D a at ψ in = −16.5 ◦ (red lines) and D b at ψ in = 76.0 ◦ (blue lines) in ZnO. The birefringence
= n a − n b is shown in the inset of panel (a), with the red dots representing the experimental
data and the solid black line representing the empirical fit determined in Sect. 3.4.2
[1]. As with ZnO, the empirical fit to the birefringence reproduces the general trend of
the data. Figure 3.11b demonstrates a monotonic increase in the absorption coeffcient
along both eigenvectors.
3.4.4 Anisotropic Absorption and Chromatic Dispersion in
CuO
To demonstrate how RP-THz-TDS can be used to investigate the absorptive properties
of anisotropic media, the dependence of the electromagnon absorption on the incident
THz orientation angle was investigated in CuO. From previous experimental and
theoretical work [35, 36], it has been shown that the electromagnon present in the
AF2 phase of CuO absorbs light only for electric fields oriented close to the [101]
direction. Since a cryostat is required to access the temparature range at which the
electromagnon is active, rotating the THz polarization state, rather than the sample,
is a highly convenient method to probe its anisotropic optical properties. RP-THzTDS was performed at 210 K, in the AF1 phase, and at 215 K, in the AF2 phase, and
the sample was oriented in the spectrometer such that the [101] direction is close to
ψ in = 0
◦ .
63
0.0
0.5
1.0
1.5
2.0
2.5
3.0
Frequency (THz)
4.2
4.4
4.6
4.8
5.0
5.2
5.4
5.6
Refract ive Index
0.0
0.5
1.0
1.5
2.0
2.5
3.0
Frequency (THz)
0
20
40
60
80
100
Absorpt ion Coefficient (cm
− 1
)
0.0 0.5 1.0 1.5 2.0 2.5
Frequency (THz)
0.00
0.01
0.02
0.03
0.04
0.05
Birefringence
(a)
(b)
Fig. 3.11 a Refractive index and b absorption coefficient of the in-plane polarisation eigenvectors
D a at ψ in = −16.5 ◦ (red lines) and D b at ψ in = 76.0 ◦ (blue lines) in ZnO. The birefringence
= n a − n b is shown in the inset of panel (a), with the red dots representing the experimental
data and the solid black line representing the empirical fit determined in Sect. 3.4.2
[1]. As with ZnO, the empirical fit to the birefringence reproduces the general trend of
the data. Figure 3.11b demonstrates a monotonic increase in the absorption coeffcient
along both eigenvectors.
3.4.4 Anisotropic Absorption and Chromatic Dispersion in
CuO
To demonstrate how RP-THz-TDS can be used to investigate the absorptive properties
of anisotropic media, the dependence of the electromagnon absorption on the incident
THz orientation angle was investigated in CuO. From previous experimental and
theoretical work [35, 36], it has been shown that the electromagnon present in the
AF2 phase of CuO absorbs light only for electric fields oriented close to the [101]
direction. Since a cryostat is required to access the temparature range at which the
electromagnon is active, rotating the THz polarization state, rather than the sample,
is a highly convenient method to probe its anisotropic optical properties. RP-THzTDS was performed at 210 K, in the AF1 phase, and at 215 K, in the AF2 phase, and
the sample was oriented in the spectrometer such that the [101] direction is close to
ψ in = 0
◦ .