

58
3 Rotatable-Polarisation Terahertz Time-Domain Spectroscopy of Anisotropic Media
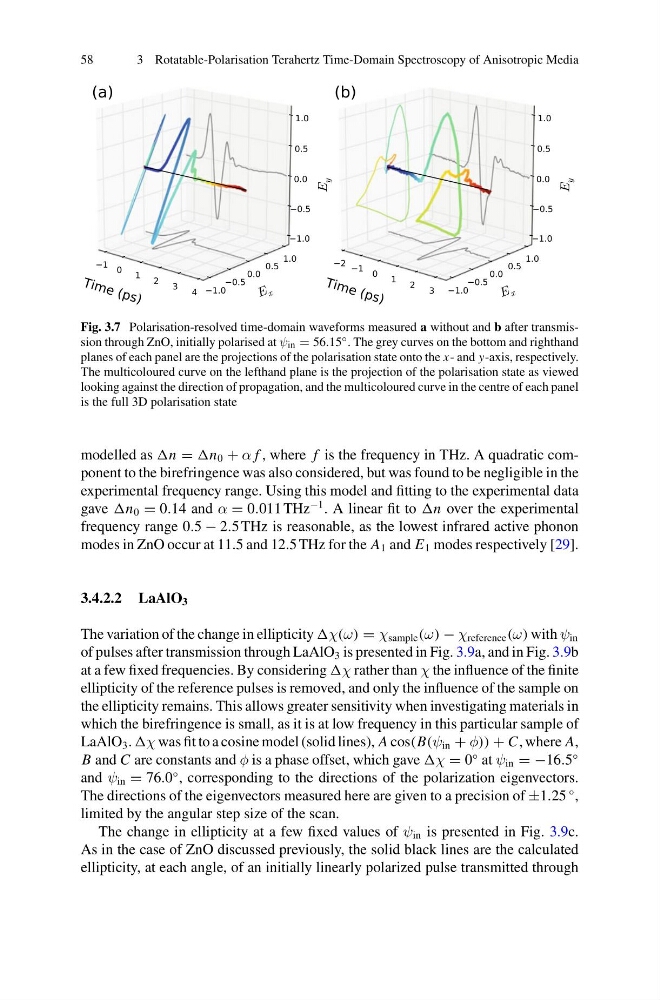
Fig. 3.7 Polarisation-resolved time-domain waveforms measured a without and b after transmission through ZnO, initially polarised at ψ in = 56.15 ◦ . The grey curves on the bottom and righthand
planes of each panel are the projections of the polarisation state onto the x- and y-axis, respectively.
The multicoloured curve on the lefthand plane is the projection of the polarisation state as viewed
looking against the direction of propagation, and the multicoloured curve in the centre of each panel
is the full 3D polarisation state
modelled as = 0 + α f , where f is the frequency in THz. A quadratic component to the birefringence was also considered, but was found to be negligible in the
experimental frequency range. Using this model and fitting to the experimental data
gave 0 = 0.14 and α = 0.011 THz
−1 . A linear fit to over the experimental
frequency range 0.5 − 2.5 THz is reasonable, as the lowest infrared active phonon
modes in ZnO occur at 11.5 and 12.5 THz for the A 1 and E 1 modes respectively [29].
3.4.2.2 LaAlO 3
The variation of the change in ellipticity = χ sample (ω) − χ reference (ω) with ψ in
of pulses after transmission through LaAlO 3 is presented in Fig. 3.9a, and in Fig. 3.9b
at a few fixed frequencies. By considering rather than χ the influence of the finite
ellipticity of the reference pulses is removed, and only the influence of the sample on
the ellipticity remains. This allows greater sensitivity when investigating materials in
which the birefringence is small, as it is at low frequency in this particular sample of
LaAlO 3 . was fit to a cosine model (solid lines), A cos(B(ψ in + φ)) + C, where A,
B and C are constants and φ is a phase offset, which gave = 0
◦ at ψ in = −16.5
◦
and ψ in = 76.0
◦ , corresponding to the directions of the polarization eigenvectors.
The directions of the eigenvectors measured here are given to a precision of ±1.25
◦ ,
limited by the angular step size of the scan.
The change in ellipticity at a few fixed values of ψ in is presented in Fig. 3.9c.
As in the case of ZnO discussed previously, the solid black lines are the calculated
ellipticity, at each angle, of an initially linearly polarized pulse transmitted through
3 Rotatable-Polarisation Terahertz Time-Domain Spectroscopy of Anisotropic Media
Fig. 3.7 Polarisation-resolved time-domain waveforms measured a without and b after transmission through ZnO, initially polarised at ψ in = 56.15 ◦ . The grey curves on the bottom and righthand
planes of each panel are the projections of the polarisation state onto the x- and y-axis, respectively.
The multicoloured curve on the lefthand plane is the projection of the polarisation state as viewed
looking against the direction of propagation, and the multicoloured curve in the centre of each panel
is the full 3D polarisation state
modelled as = 0 + α f , where f is the frequency in THz. A quadratic component to the birefringence was also considered, but was found to be negligible in the
experimental frequency range. Using this model and fitting to the experimental data
gave 0 = 0.14 and α = 0.011 THz
−1 . A linear fit to over the experimental
frequency range 0.5 − 2.5 THz is reasonable, as the lowest infrared active phonon
modes in ZnO occur at 11.5 and 12.5 THz for the A 1 and E 1 modes respectively [29].
3.4.2.2 LaAlO 3
The variation of the change in ellipticity = χ sample (ω) − χ reference (ω) with ψ in
of pulses after transmission through LaAlO 3 is presented in Fig. 3.9a, and in Fig. 3.9b
at a few fixed frequencies. By considering rather than χ the influence of the finite
ellipticity of the reference pulses is removed, and only the influence of the sample on
the ellipticity remains. This allows greater sensitivity when investigating materials in
which the birefringence is small, as it is at low frequency in this particular sample of
LaAlO 3 . was fit to a cosine model (solid lines), A cos(B(ψ in + φ)) + C, where A,
B and C are constants and φ is a phase offset, which gave = 0
◦ at ψ in = −16.5
◦
and ψ in = 76.0
◦ , corresponding to the directions of the polarization eigenvectors.
The directions of the eigenvectors measured here are given to a precision of ±1.25
◦ ,
limited by the angular step size of the scan.
The change in ellipticity at a few fixed values of ψ in is presented in Fig. 3.9c.
As in the case of ZnO discussed previously, the solid black lines are the calculated
ellipticity, at each angle, of an initially linearly polarized pulse transmitted through