

98
5 High-Field Terahertz Time-Domain Spectroscopy …
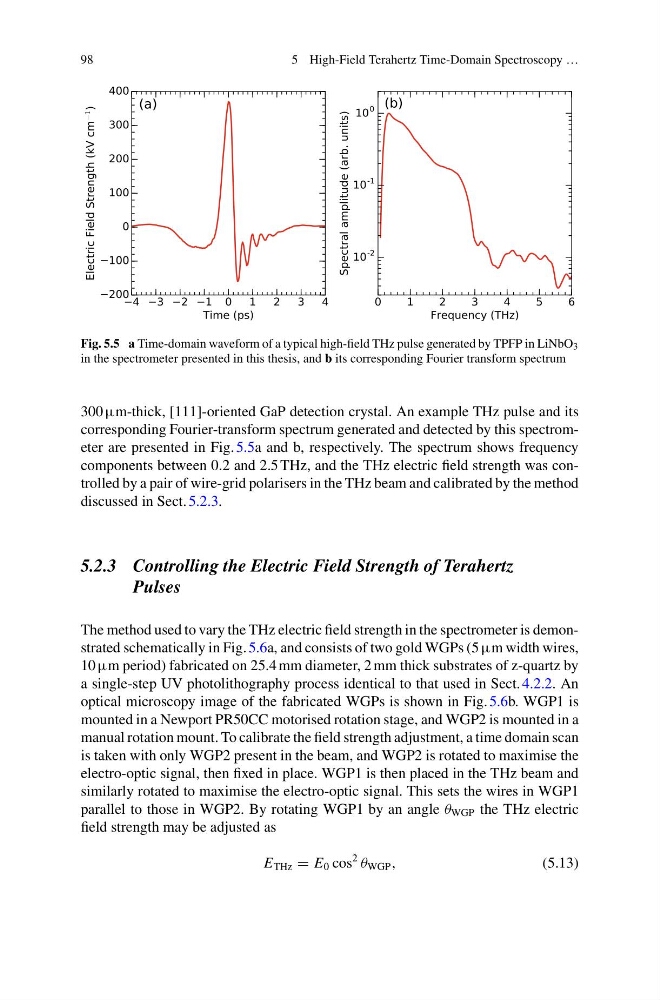
Fig. 5.5 a Time-domain waveform of a typical high-field THz pulse generated by TPFP in LiNbO 3
in the spectrometer presented in this thesis, and b its corresponding Fourier transform spectrum
300 µm-thick, [111]-oriented GaP detection crystal. An example THz pulse and its
corresponding Fourier-transform spectrum generated and detected by this spectrometer are presented in Fig. 5.5a and b, respectively. The spectrum shows frequency
components between 0.2 and 2.5 THz, and the THz electric field strength was controlled by a pair of wire-grid polarisers in the THz beam and calibrated by the method
discussed in Sect. 5.2.3.
5.2.3 Controlling the Electric Field Strength of Terahertz
Pulses
The method used to vary the THz electric field strength in the spectrometer is demonstrated schematically in Fig. 5.6a, and consists of two gold WGPs (5 µm width wires,
10 µm period) fabricated on 25.4 mm diameter, 2 mm thick substrates of z-quartz by
a single-step UV photolithography process identical to that used in Sect. 4.2.2. An
optical microscopy image of the fabricated WGPs is shown in Fig. 5.6b. WGP1 is
mounted in a Newport PR50CC motorised rotation stage, and WGP2 is mounted in a
manual rotation mount. To calibrate the field strength adjustment, a time domain scan
is taken with only WGP2 present in the beam, and WGP2 is rotated to maximise the
electro-optic signal, then fixed in place. WGP1 is then placed in the THz beam and
similarly rotated to maximise the electro-optic signal. This sets the wires in WGP1
parallel to those in WGP2. By rotating WGP1 by an angle θ WGP the THz electric
field strength may be adjusted as
E THz = E 0 cos
2
θ WGP ,
(5.13)
5 High-Field Terahertz Time-Domain Spectroscopy …
Fig. 5.5 a Time-domain waveform of a typical high-field THz pulse generated by TPFP in LiNbO 3
in the spectrometer presented in this thesis, and b its corresponding Fourier transform spectrum
300 µm-thick, [111]-oriented GaP detection crystal. An example THz pulse and its
corresponding Fourier-transform spectrum generated and detected by this spectrometer are presented in Fig. 5.5a and b, respectively. The spectrum shows frequency
components between 0.2 and 2.5 THz, and the THz electric field strength was controlled by a pair of wire-grid polarisers in the THz beam and calibrated by the method
discussed in Sect. 5.2.3.
5.2.3 Controlling the Electric Field Strength of Terahertz
Pulses
The method used to vary the THz electric field strength in the spectrometer is demonstrated schematically in Fig. 5.6a, and consists of two gold WGPs (5 µm width wires,
10 µm period) fabricated on 25.4 mm diameter, 2 mm thick substrates of z-quartz by
a single-step UV photolithography process identical to that used in Sect. 4.2.2. An
optical microscopy image of the fabricated WGPs is shown in Fig. 5.6b. WGP1 is
mounted in a Newport PR50CC motorised rotation stage, and WGP2 is mounted in a
manual rotation mount. To calibrate the field strength adjustment, a time domain scan
is taken with only WGP2 present in the beam, and WGP2 is rotated to maximise the
electro-optic signal, then fixed in place. WGP1 is then placed in the THz beam and
similarly rotated to maximise the electro-optic signal. This sets the wires in WGP1
parallel to those in WGP2. By rotating WGP1 by an angle θ WGP the THz electric
field strength may be adjusted as
E THz = E 0 cos
2
θ WGP ,
(5.13)